Hydraulic Design of a 3 kW-Class Pump-turbine Model and Performance Investigation by CFD
Abstract
Small hydro is a valuable source of energy for remote area power generation. Pump-turbines are one of the most efficient ways to make and utilize the hydro energy. The purpose of the study is to design a pump-turbine model and conduct CFD analysis for performance prediction. The pump-turbine system is to be installed using an existing Francis turbine experiment model facility, so the overall casing and draft tube dimensions of the pump-turbine are the same as the existing Francis turbine. Only the dimensions of the stay vanes, guide vanes and impeller are different. Several impeller designs were investigated to match the design requirements of the model test facility. The performance and internal flow characteristics of the initial and final designs are compared and the best design is suggested for manufacturing for testing in the model test facility. The CFD results show relatively good results in both modes achieving more than 80% in hydraulic efficiency.
Keywords:
Hydraulic design, Impeller, Internal flow, Performance, Pump-turbine키워드:
수력설계, 임펠러, 내부유동, 성능, 펌프터빈1. Introduction
Small hydro power is a valuable source of energy for rural industries and village electrification projects. Pump-turbines are one of the most efficient ways to utilize the hydro energy. The purpose of the study is to design a pump-turbine model and conduct numerical analysis for performance prediction. The study focuses on the design and numerical analysis of a 3 kW-class pump-turbine model that could be implemented for providing clean and stable electricity in small island regions. A small pump-turbine can be applied in locations where other renewable energy systems like wind and solar are available to develop a hybrid system so that clean energy can be used for the pumping mode.
The system can also be applied in South Korea because there is potential to develop several islands that can be energy independent. Currently, most of the islands are not connected to the grid of the main land so the only means of electricity generation is by diesel generators or some renewable energies like wind turbines and solar power.(1-3) Additionally, a 3 kW pump-turbine does not require a large head and a head of approximately 15 m is sufficient for the design and application. Several other renewable energy systems like wind turbines, tidal turbines and solar energy could be used to develop a hybrid system, where the pump-turbine will be used for balancing the grid during high energy demand. The excess energy that is normally wasted by other renewable energy converters can be used in the pumping mode to restore the hydro energy.
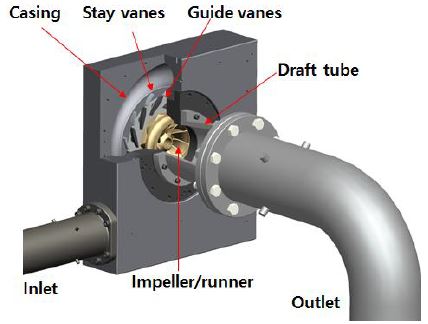
In this study the pump-turbine model was designed and computational fluid dynamics (CFD) analysis for performance prediction and improvement was conducted. The pump-turbine system is to be installed using an existing Francis turbine experiment model facility as shown in Fig. 1. The first purpose of the study has been achieved, which was to design a pump-turbine system and conduct CFD analysis for performance test. Additionally, the study aims to develop the actual impeller, guide vanes, stay vanes and casing for an experiment model test. The long term objective of the study is to introduce J-grooves on the draft tube of the pump-turbine system and study its effects on reducing the unsteady flow phenomena that occur in the draft tube.
2. Pump-turbine Impeller Design
The study has focused on the hydraulic designs using a head of HP = 15 m and flow rate of Q = 0.02 m3/s for P=3 kW-class pump-turbine. The turbine mode design head is HT = 15 m and flow rate is Q = 0.026 m3/s. The corresponding specific speeds for pump and turbine modes are nsp = 31 m-m3/s and nst = 95 m-kW respectively. The design considers the method of gradient of discharge variation to head variation derived from a pump-turbine design method by Kubota(4). The method has been previously investigated by the author for conventional large sized pump turbines(5). For the past century, developed countries have devised pump-turbine designs by conducting several experiments and developed their own theories and relevant factors important to the pump-turbine design(6-9). It is used as a reference and certain techniques can be applied to the pump-turbine impeller design for the current study. The rotational speed is one of the most important parameters that are selected first. This study will use the same rotational speed of the model Francis turbine in the current facility as n=1800 min-1. Both of the pump and turbine modes are operated at the same rotational speed because a synchronous motor generator is utilized in modern pump-turbines.
The specific speed of the pump and turbine can be calculated by equations (1) and (2) respectively:
| (1) |
| (2) |
A draft impeller meridional shape can be obtained from equations (3) to (6). The peripheral speed u2 at the impeller exit at best efficiency point can be expressed by the following equation:
| (3) |
After obtaining the peripheral speed the diameter at the impeller exit, D2 can then be found by equation (4):
| (4) |
The width Bg can be found by the following equation:
| (5) |
Finally, a rough estimation of the impeller entrance diameter D1 can be determined by:
| (6) |
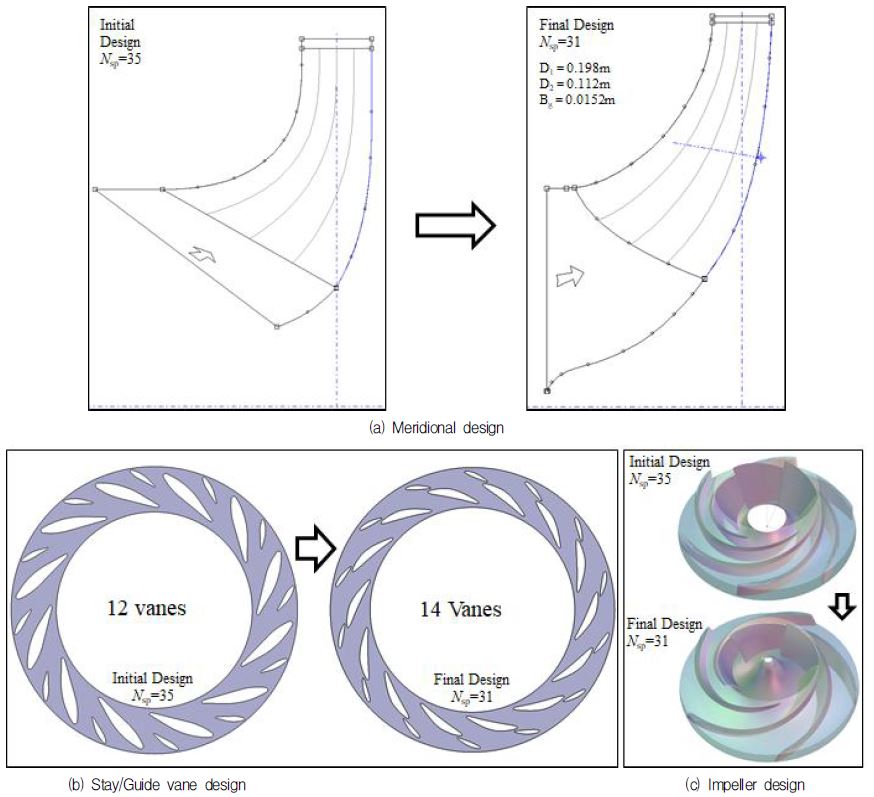
Several case studies were conducted to achieve a suitable design that matched well with the design parameters. Key differences between the initial design to the modified design parameters are presented in Table 1. The initial and final designs of the major components have been compared in Fig. 2. The main differences from the initial to final design are the blade number, blade width, Bg and the diameter, D1. The stay vane and guide vane shapes and sizes were also modified to fit all the components in the existing casing taking into account that the parts would be economical to manufacture and assemble. Therefore, the specific speed of the pump-turbine was changed from 35 to 31 m-m3/s to achieve a better design.
Excluding the initial design, all other design included the pipe loss calculation for the pump mode. Even though the design head is 15 m, the pipe loss adds to this head and increases it. However, in realty the head achieved will be 15 m. After the calculation of pipe loss, the specific speed had to be re-calculated so the specific speed changed from the initial design of 35 to 31 m-m3/s for the final design. Moreover, the blade dimensions also had to be recalculated. Design comparisons are presented in Table 1.
3. Numerical Method
The fluid domain of the pump-turbine geometry was modelled in 3D and a numerical mesh was generated. The analysis calculation was conducted using a commercial software ANSYS CFX (10). Previously available shape for guide vanes, stay vanes, draft tube and casing for a pump-turbine was used for the full domain analysis. It consists of a spiral casing, 14 stay vanes, 14 guide vanes and an impeller with 5 blades.
The general connection at the rotational interface and fixed interfaces was set as frozen rotor for a steady state calculation. The shear stress transport turbulence model has been adopted in this study because of its superiority to estimate both separation and vortex occurrence on the wall of complex blade shapes. The total pressure boundary condition was applied at the inlet and static pressure was set for the outlet in the turbine mode (TM). With this boundary condition the head can be fixed while the flow rate is determined by calculation according to guide vane opening. For the pump mode (PM) the static pressure boundary condition was applied at the inlet and mass flow rate was set for the outlet. The boundary conditions for the numerical analysis are summarized in Table 2.
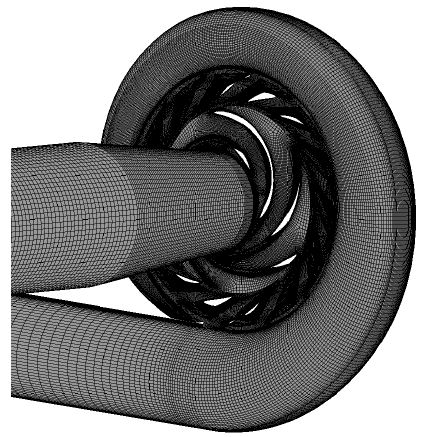
The numerical mesh for all the components were constructed using the hexahedral mesh. The full domain calculation model and refined hexahedral mesh on a single impeller is shown in Fig. 3. The generated mesh had more than 3.5×10⁶ nodes and elements. The calculation also includes the clearance gap or leakage component in the numerical analysis to capture a more accurate calculation for future comparison to experiments. A mesh dependence test was done using a refined mesh of more than 6.5×10⁶ nodes and elements. The results of the two meshes did not show large variations, so the lower mesh number was used for all other cases.
4. Results and Discussion
4.1. Performance Characteristics
The performance characteristics of all the designs have been presented in this section. In total there were four main designs leading to the final design. The initial design was the most basic design that resembled the previous Francis turbine meridional shape and the same guide vane shape. The number of blades of the initial design differs from the modified designs and the final design. The design progressed with advise from experts in the field of turbo-machinery, especially in pump turbine design technology. After the modification of the first meridional shape, the blade numbers were also corrected to mitigate the excitation effects between the guide vane and impeller vane. The corrected blade number from the modified design to the final design is 5 and the stay vane number was changed from 12 to 14. Due to this change the specific speed also reduced from 35 to 31 m-m3/s.
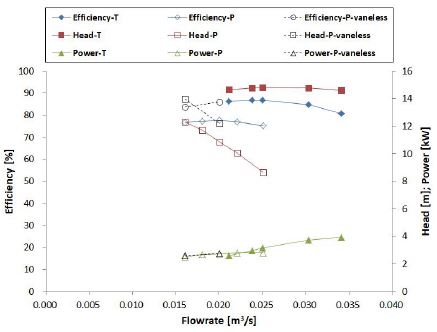
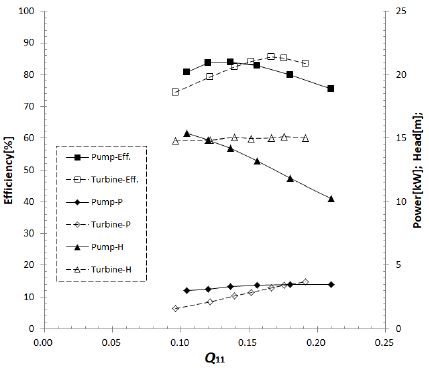
The performance characteristics of the initial design is presented in Fig. 4. The results of both pump and turbine modes have been included providing the efficiency, power and head according to the flow rate. The CFD analysis was conducted without taking the clearance gap into consideration. The initial results were not satisfactory, meaning that it did not achieve the design parameters. Although the turbine mode performed well, the pump mode did not do so well in terms of efficiency and head. The efficiency in turbine mode was greater than 86% where as in pump mode it was a low 81%. The main reason for this is that the guide vanes used are not suitable for the pump mode. To check this, additional cases were conducted without any stay vanes and guide vanes. The results shown in dotted lines clearly show increase in head and efficiency while the power is maintained. However, the guide vanes and stay vanes cannot be removed because they are vital in maintaining the efficiency and power for the turbine mode. Therefore, the shape design of the guide vanes and stay vanes was improved and reanalyzed. The pump-turbine is a complicated turbo-machine that requires a balance in performance between the two modes and it is very difficult to control the trade up and down relationship of the two modes.
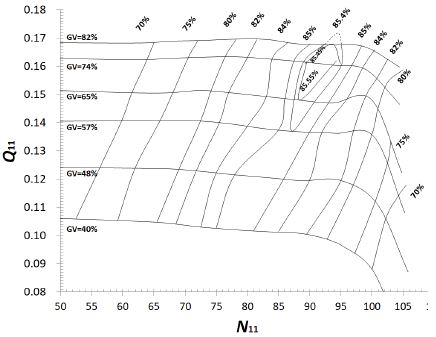
The final design CFD results with the consideration of clearance gap has been presented in Fig. 5, with the turbine mode hill chart presented in Fig. 6. The design showed considerable improvement in both modes of operation. The maximum efficiencies in turbine mode and pump mode were achieved as 86 and 84.7 percent, respectively. The design head was also achieved for both modes at 15 m. The turbine mode produced a maximum of 3.2 kW power and the pump mode consumed a maximum 3.5 kW of power in the design operating conditions. The hill chart in Fig. 6 presents the various guide vane openings that were checked for the efficiencies according to the unit rotational speed, N11 and unit flow rate, Q11. It can be seen that the turbine mode performed quite well over various rotational speed and flow rates with high efficiencies.
4.2. Internal Flow Characteristics
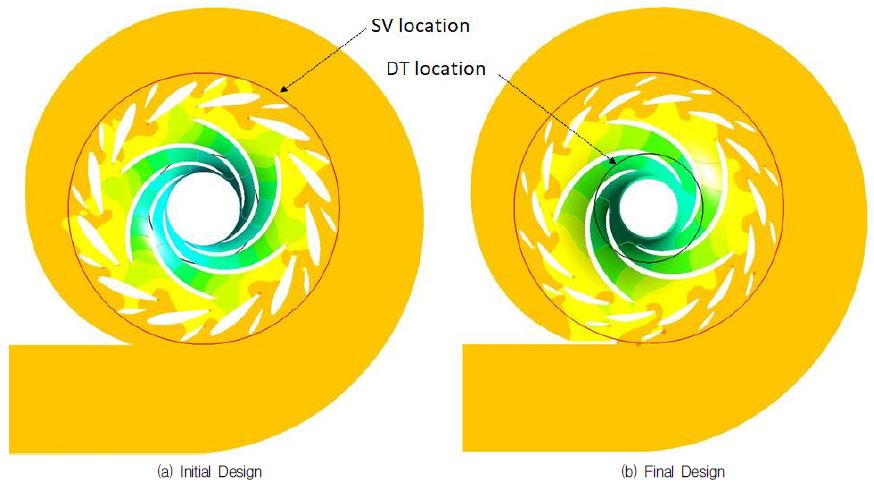
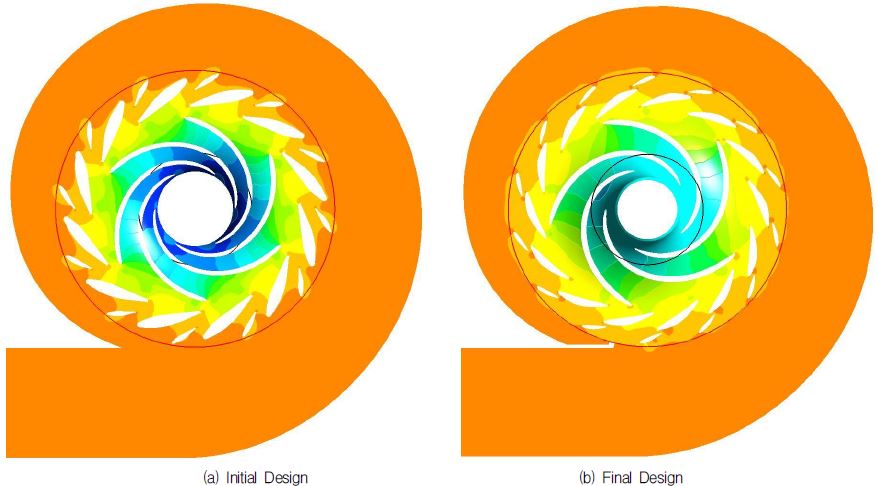
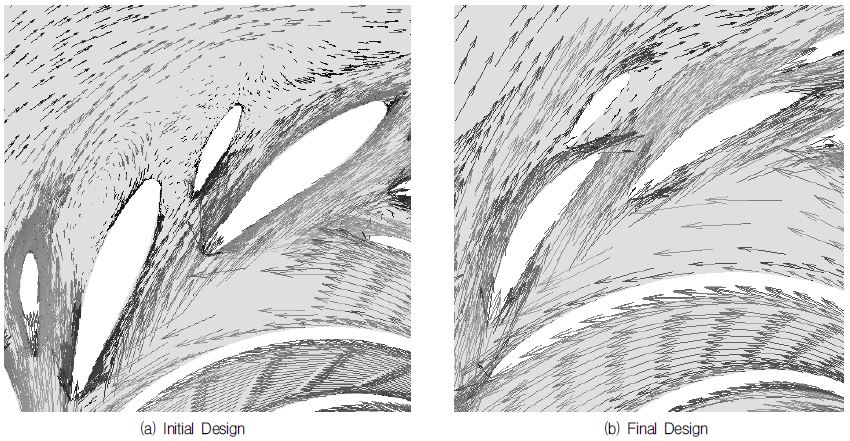
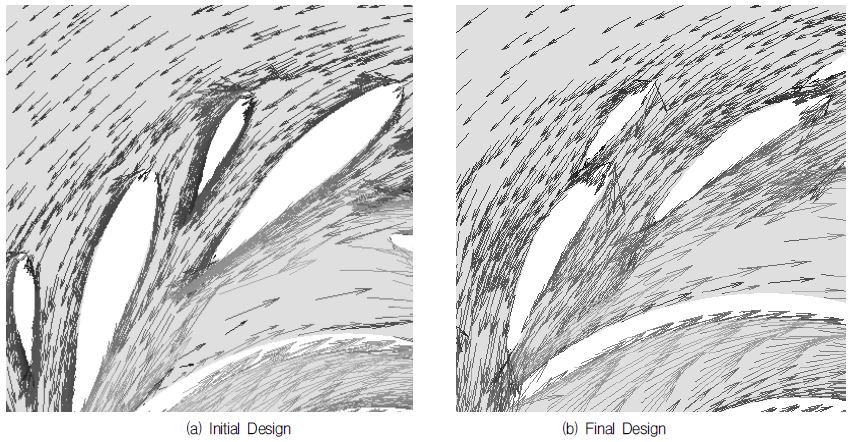
The separate components in the pump-turbine system were investigated qualitatively and quantitatively by investigating the pressure contours and velocity vectors in the middle section of each component. The pressure contours for the pump and turbine modes at the best efficiency points for the initial and final designs are compared in Figs. 7 and 8, respectively. The velocity vector distributions that show significant comparisons between each design in the pump and turbine modes have been presented in Figs. 9 and 10. It can be observed that there is very small variation on the flow pattern in the turbine modes but the flow in the pump mode improves from the initial to the final design. A significant improvement of the flow is observed in the pump mode at the guide vanes and stay vanes from the initial design to the final design. This is mostly because of the change in the shape design of the vanes. The recirculation flows that occur in the initial design are mitigated significantly. It is observed that the recirculation flows were completely mitigated by the improved design of the stay vanes, guide vanes and impeller meridional shapes.
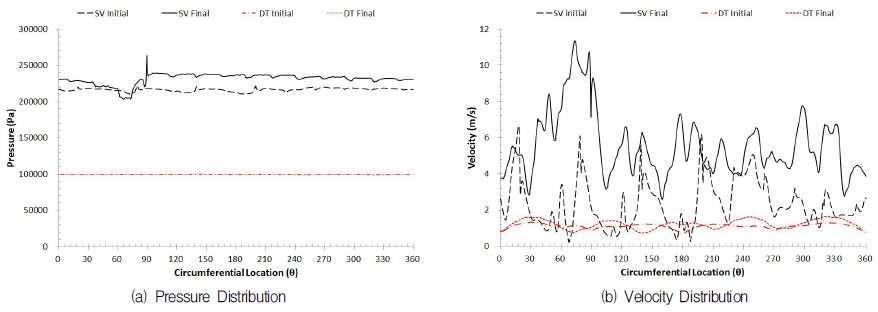
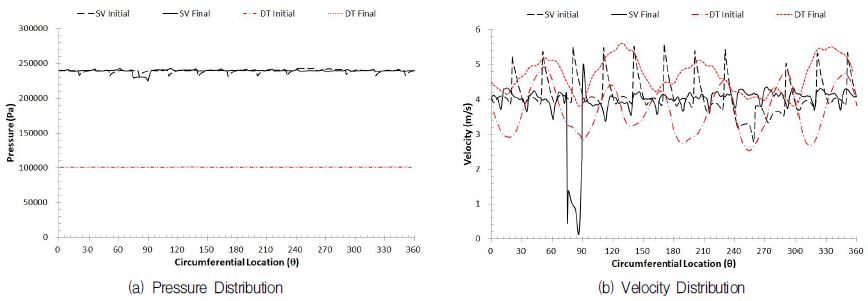
A quantitative approach was made to investigate the pressure and velocity components at the circular locations shown in Figs. 7 and 8 to compare the initial and final designs. The results are presented in Figs. 11 and 12, which shows the comparison of the pump and turbine modes respectively. There is a significant difference observed in the pressure and velocity distribution in the pump mode, especially at the stay vane location. A significant increase in pressure is observed in the pump mode from the initial to the final design which gives reason for improved performance. The pressure and velocity distribution at the draft tube did not show any significant change among the two designs. The same was observed in the turbine mode which also explains why there was no significant change in the performance of the turbine modes of the two designs.
5. Conclusion
The study investigated the design and performance of a small pump-turbine model by CFD. During the design process, the comparison of internal flows and performance curves are useful methods to investigate the different designs. The velocity vectors provide a qualitative approach and can clearly identify the recirculation areas in the whole section of the pump-turbine so that areas that need modification can be easily identified. Using this method the stay vanes and guide vanes were revised and in the final design it is clearly observed that the recirculation flows were significantly mitigated. The performance curves also gives a better idea to the designer about the difficulty in the trade up and down relationship of the pump-turbine system because as one mode improves, the other worsens. However, in the final design a balanced relationship of both modes were achieved with the desired requirements.
Acknowledgments
This work was supported by the New and Renewable Energy of the Korea Institute of Energy Technology Evaluation and Planning (KETEP) grant funded by the Korea government Ministry of Trade, Industry and Energy (No. 20163010060350).
References
- Lee, J. C., (2015), Implementation of Hybrid Micro Grid System for Island, Proceedings of the Korean Society for New and Renewable Energy, 86.
- (2010), Department of Economic and Social Affairs, Trends in Sustainable Development Small Island Developing States (SIDS), Available at: http://sustainabledevelopment.un.org/content/documents/313Trends_in_Sustainable_Development_SIDS.pdf.
- Weiser, D., (2004), On the Economics of Electricity Consumption in Small Island Developing States: A Role for Renewable Energy Technologies, Energy Policy, 32(1).
- Krishna, H. R., (1997), Hydraulic Design of Hydraulic Machinery, Ashgate Publishing Limited, England, p465-484.
-
Singh, P. M., and Choi, Y. D., (2017), Initial Hydraulic Design and Performance Analysis of 300 MW-Class Pump-turbine Model, Journal of the Korean Society for Fluid Machinery, Vol. 20(No. 3), p18-25.
[https://doi.org/10.5293/kfma.2017.20.3.018]

- Krivchenko, G., (1994), “Hydraulic Machines: Turbines and Pumps”, 2nd Edition, Lewis Publishers, CRC Press, Inc., Florida, USA, p367-396.
- Mei, Z. Y., (1991), “Mechanical Design and Manufacturing of Hydraulic Machinery”, Avebury Technical, England.
- Stelzer, R. S., and Walters, R. N., (1977), Estimating Reversible Pump-turbine Characteristics, U.S. Government Printing Office, Washington, Engineering Monograph No. 39.
- Kovalev, N. N., (1965), Hydroturbines: Design and Construction, S. Monson, Binding K. Wiener, Jerusalem.
- ANSYS Inc., ANSYS Documentation: CFX, Ver. 18, (2017).
