Optimum Design on the Meridional Shape of a Multistage Centrifugal Pump Impeller for Performance Improvement
Abstract
As it has been proven, the design of impeller meridional shape directly influences the performance of multistage centrifugal pump. In this study, the five parameters of the double-arc meridional shape design method were selected as the design variables. A multi-point hydraulic optimum design method of impeller meridional shape for multistage centrifugal pump performance improvement was presented. The maximum hydraulic efficiency and effective head were chosen as the objective functions. The design of experiment method was applied to generate different impeller meridional shapes and a total of 50 sampling models were generated using the Latin Hypercube Method. The Reynolds Average Navier Stokes equations were adopted to conduct the numerical calculations. To validate the performance improvement of the optimal design model, efficiencies of the optimal design model at flow rates of 0.8Qref, 1.0Qref, and 1.2Qref were compared with the original reference model. The optimal efficiencies under the three operation conditions increased by 1.9%, 1.6%, and 0.9%, respectively. In addition, the CFD analysis of a two-stage multistage pump assembled by impellers, continuous diffuser and return vanes was conducted. The cavitation performance was also validated.
Keywords:
Meridional shape of impeller, Multistage centrifugal pump, Performance improvement, Optimum design, CFD analysis키워드:
임펠러 자오면 형상, 다단 원심펌프, 성능향상, 최적화 설계, 전산유체역학 해석1. Introduction
A pump is a device that can transport different kinds of fluid and solid materials by mechanical action. Pumps operate by some mechanism, typically reciprocating or rotary, and consume energy to perform mechanical work for transportation. Multistage centrifugal pump, most common type of pumps, has been widely used in industry and agriculture, such as drainage, sewage disposal etc.
Numerical method has been already applied for pump performance prediction. However, for the long-term benefits and energy saving, the optimization should be considered to improve the performance of multistage centrifugal pump. In centrifugal pump, the impeller is a key component that transform fluid machinery energy into fluid pressure and kinetic energy. As proven, the impeller meridional shape directly influences the performance of pump system. So it is worth of deep study on the impeller meridional shape optimization.
There are few of literatures about the optimization on the design of centrifugal pump impeller. Kim et al.(1) had studied the influence of design parameters in vane plane development on the performance of impellers with fixed meridional geometry. The efficiency was improved 0.26% compared with the original design. Kim et al.(2) selected the inlet angle and outlet angle of impeller as the design variables to do optimization of centrifugal pump impeller by using CFD and RSM method. Miyauchi et al.(3) developed an optimization method by applying the 3D inverse design method to optimize the relative velocity in meridional channel.
In this study, the basic dimensions of impeller design are fixed. Two-arc method was chosen for impeller meridional shape design. Moreover, a multi-point hydraulic optimization of impeller meridional shape by using Response Surface Methodology (RSM)(4) and Evolutionary algorithms (EA)(5) is proposed. Five variables of meridional shape are selected as design variables. A commercial CFD code has been adopted to perform the calculation. After the optimization process finished, the validation of optimal result was conducted and compared with the reference model.
2. Impeller design parameters
Table 1 shows the design specification of multistage pump impeller. This impeller operates with a high rotational speed of 4350 rpm. The head coefficient(φ) is 0.527 at the design point. Actually, this impeller is applied in a multi-stage pump(6-stage), which is used as a fundamental part of a descaler. However, in order to decrease the CFD calculation time, another suitable volute was selected and assembled with this impeller. The performance of this centrifugal pump was calculated and compared with each other. All the cases for optimization used the same volute and operation conditions to evaluate the performance difference of the impeller. Finally, a two stage multistage model with the original impeller and optimal impeller were tested to check the performance improvement.
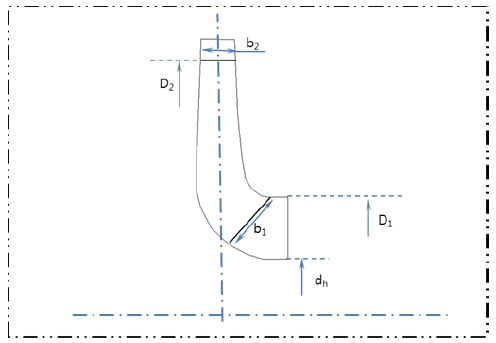
Fig. 1 shows the 2-D meridional shape of the impeller. The main geometric design parameters of the impeller are listed in Table 2.
3. Multi-objective optimization process
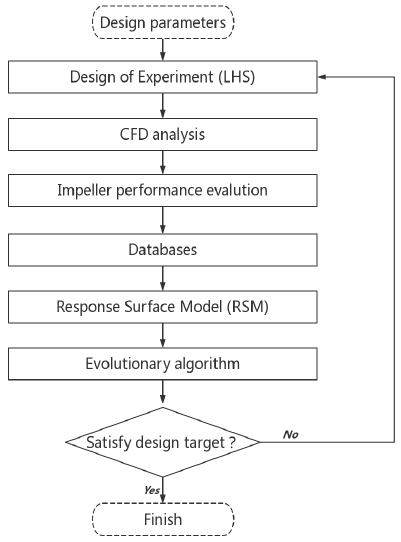
Optimum design of turbomachinery includes many steps, such as modeling configuration, CFD performance estimation and optimization calculations. Fig. 1 presents the process of optimization strategy introduced in this paper. ANSYS CFX 18.1(6) is employed to conduct the hydraulic performance evaluation in different operation conditions. The relationship between input parameters and objective functions were built by Response Surface Methodology. The effective Latin Hypercube Sampling Method(7) is used to generate approximate sampling distribution and reduce the amount of computation. The optimization process is founded by the commercial software ANSYS Optislang(8).
3.1. Meridional shape design method
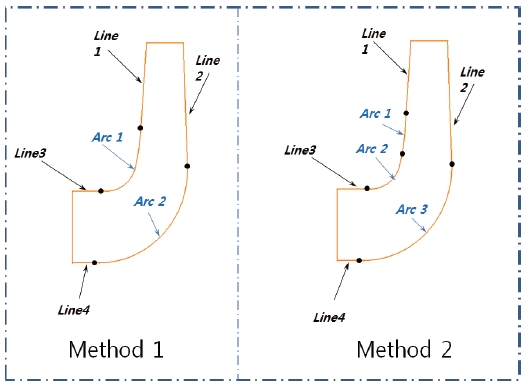
There are different meridional shape design methods for impeller. As shown in Fig. 3, One-arc method(Method 1) and Two-arc method(Method 2)(9) are relatively widespread used. The One-arc method is less complicated and fewer design variables which need to be considered. However, as it has been proven from the design practice and detailed application, the performance of impellers designed by Two-arc method are more excellent and efficient. So the Two-arc method has been selected to design the meridional shape during the optimization process.
3.2. Design variables and objectives
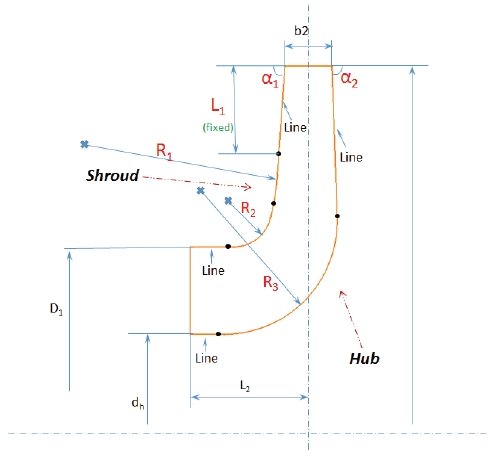
Fig. 4 shows the geometric relationship among different lines, arcs and angles. In design process of meridional shape, if the value of R1, R2, R3, L1, α1, α2 can be determined, there will be only one unique meridional shape of impeller which can be drawn. Moreover, in this study, L1 is fixed and R1, R2, R3, α1, α2 are selected as design variables. The range of design parameters are shown in Table 3. The upper and lower limit were determined according to locations and values of different parameters. The lines and arcs of meridional shape need a smooth transition. If a big change is applied suddenly, meridional shape can not be generated. The parameters of reference model have been set as 1(Dimensionless value).
For impeller optimization, the effective head and efficiency of impeller based on design point were selected as objectives to check the effectiveness of optimization. The objective functions are defined as follows:
| (1) |
| (2) |
Where the T is the input torque, p1 and p2 are the static pressures measured in Pa at the outlet and inlet respectively; v1 and v2 are the velocities with a unit of m/s at inlet and outlet respectively; g is the standard earth Gravity.
3.3. Numerical method
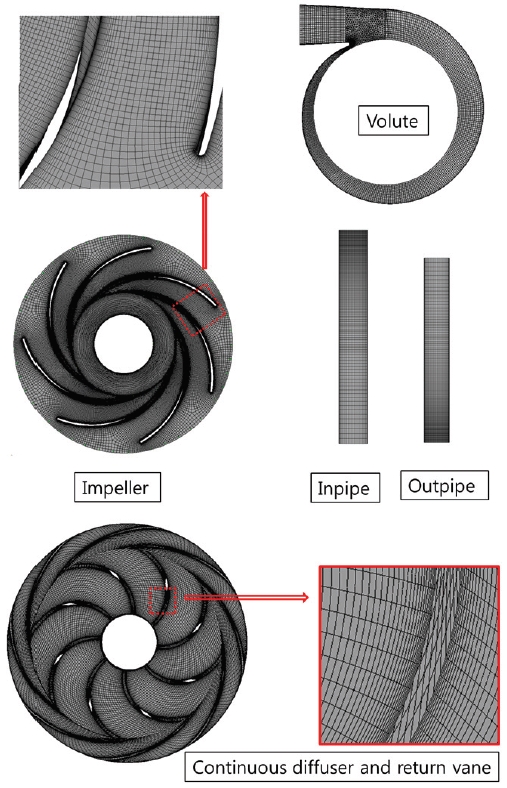
The computational domains are shown in Fig. 5. Including volute, impeller, extended inpipe, outpipe and continuous diffuser and return vane. Hexahedral mesh was applied in the whole fluid domain of model except the part of tongue area of volute.
The non-dimensional wall distance values of y+ for impeller and volute are show in Table 4.
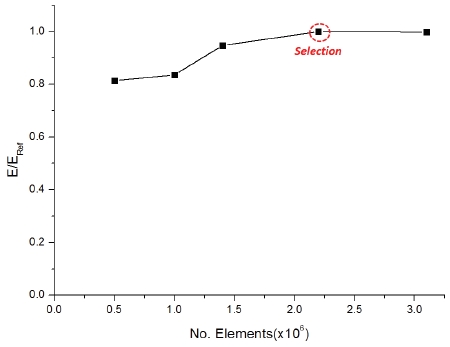
The boundary condition for CFD analysis is shown in Table 5. The SST turbulence model was adopted to conduct numerical calculations. So the y+ values of impeller and other parts were set below 8 and 22, respectively. Fig. 6 shows numerical mesh dependence of centrifugal pump in CFD analysis and total mesh number 2.2×10⁶ was selected for CFD analysis. Additionally, the mesh number of continuous diffuser and return vane was determined as 1.5 times of centrifugal volute. Boundary condition for two stage multistage pump validation was the same with the centrifugal pump. The frozen rotor model is used for interface between stationary component and rotational component. Moreover, total pressure was set at inlet and mass flow rate was set at outlet.
3.4. Design of experiment(DoE)
The sampling point distribution directly affects the results of the optimization. So the sampling method plays an important role in the optimization process. The Latin Hypercube Sampling Method(LHS) has been selected in this study. This LHS method is a statistical method for generating a near-random sample of parameter values from a multidimensional distribution. Moreover, the number of sampling points can be prescribed manually according to the adopted approximate model. The advantage of LHS method is its ability to fill space and its high response of non-linear fitting. The least number of sampling points is calculated by the equation as follows:
| (3) |
This equation is used for quadratic approximation model(7). N is the number of selected design variables. In this study, 50 sampling impellers were generated.
3.5. Response surface methodology
In general, there is usually a unknown relationship between the input and output. The purpose of optimization is to find this implicit relationship. It can be described by Eq.(4).
| (4) |
In this paper, the Response Surface Methodology (RSM) is employed to find the approximate relationship between input design variables and output target by using polynomials. The polynomial equation of RSM is shown in Eq.(5):
| (5) |
The polynomial coefficient can be found by principle of least square regression(4).
3.6. Evolutionary algorithm
Evolutionary algorithm (EA), which is stochastic search methods that mimic process of natural biological evolution like adaption, selection and variation, shows a good performance in multi-point optimization.
In this study, Evolutionary algorithm (EA) is employed in optimization process. The detailed setting parameters are listed in Table 6.
4. Results and discussion
4.1. Optimized results
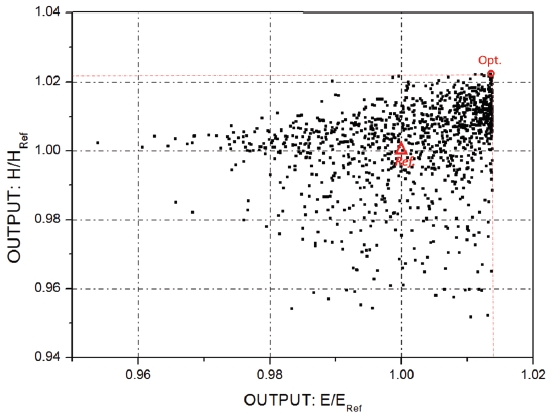
The relationship between output head and efficiency is shown in Fig. 7. Total 10000 impellers have been generated, and the design parameters are determined by Evolutionary algorithm (EA). From the optimization result, it can be seen that there is a point(marked red circle) that can achieve best effective head and efficiency with no conflicting. This point is selected for further investigation. Moreover, the prediction of Evolutionary Algorithm shows that the efficiency of this point increases by 1.3% and effective head increases by 2.2%, respectively.
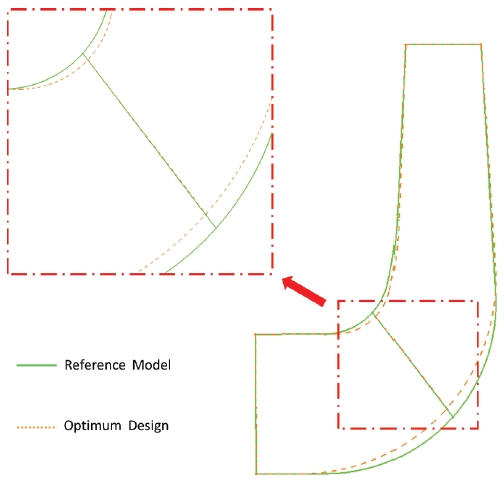
Fig. 8 shows the comparison of the optimal meridional shape with the original reference meridional shape. The impeller performance can be influenced by the location of leading edge. Thus, this variable has been controlled at the same location. Table 7 shows the reference parameters and the optimized parameters of impeller meridional shape.
4.2. Validation
Even the optimization results of impeller meridional shape have been obtained. However, the validity of the optimal result still need to be verified. This validation step is indispensable in the optimization process. Table 8 shows the comparison of optimized prediction and optimized CFD computational results. The efficiency is almost the same with prediction. But effective head is a bit lower. Although the predicted and computational results are a little different, the fitting trend can be proved that it is correct.
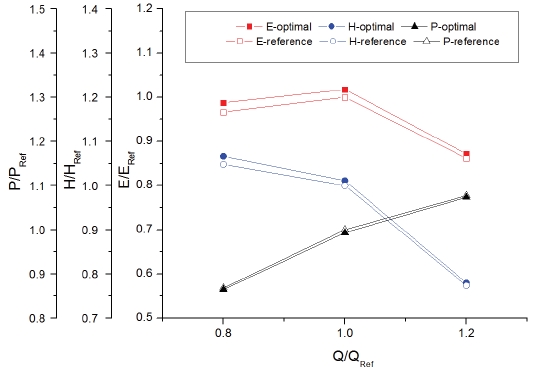
Fig. 9 shows the performance curves of optimization impeller and original reference impeller. PRef, HRef, ERef are the flow rate, Power, Head and Efficiency at the design point. The 0.8Qref, 1.0Qref and 1.2Qref have been selected because in practical applications these operation points are more representative and important to measure the performance of impeller.
At the design point, compared with the original impeller, there are a 1.6% efficiency improvement and head enhancement of 1.4%. Moreover, at the flow rate of 0.8Qref and 1.2Qref, the efficiency is 1.9% and 0.9% higher, respectively.
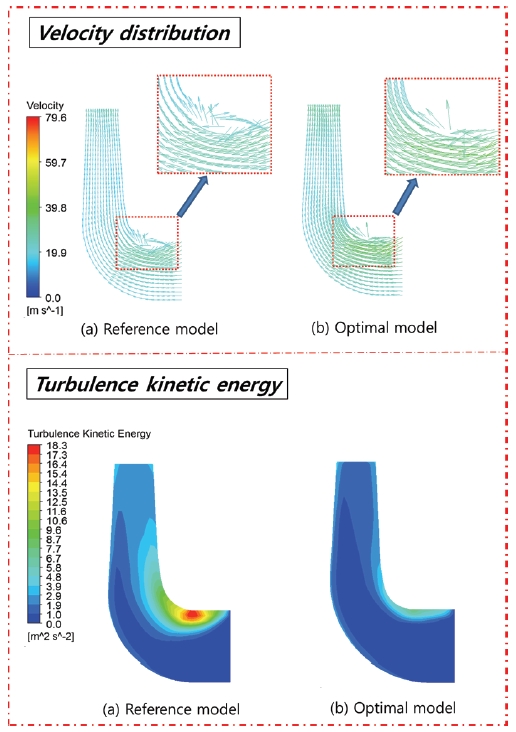
Fig. 10 shows the velocity and turbulence kinetic energy distribution of impeller. From the velocity distribution, it can be seen that there is a big recirculation flow near the shroud. Optimal meridional shape efficiently suppressed the recirculation flow and reduced its strength.
The turbulence kinetic energy distribution, a useful tool to check the internal flow, is applied to investigate the turbulence distribution in the impeller. As we know, the turbulence kinetic energy is related to the energy loss. The distribution of turbulence kinetic energy in Fig. 10 shows that the same area near shroud has a large amount of kinetic energy. It can be concluded that there is a large hydraulic energy loss. Because recirculation flow exists, the turbulence kinetic energy strength increases a lot. The hydraulic energy loss in impeller also increases a lot. The optimized model is very effective on ameliorating these flow conditions. That is why the efficiency and effective head of optimized model can be improved.
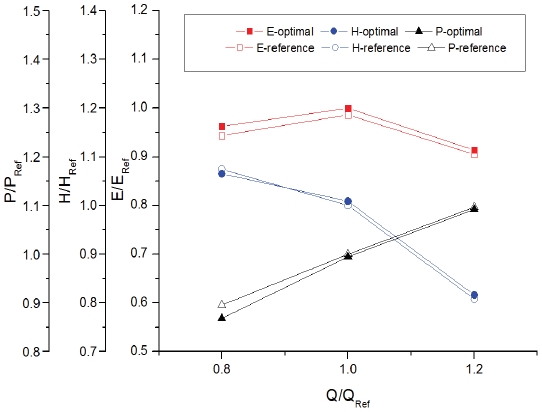
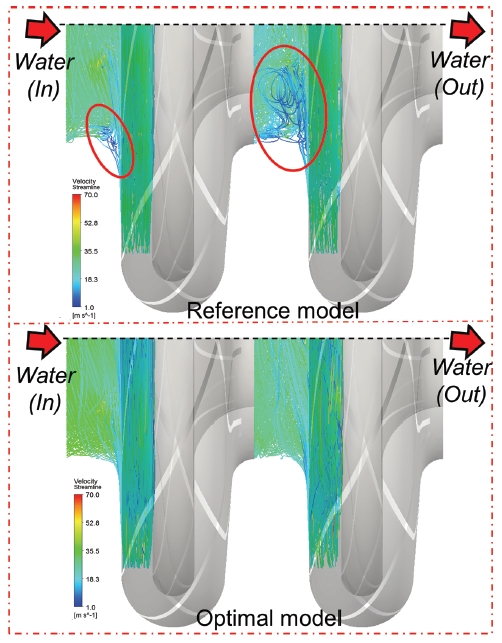
Fig. 11 presents the performance curves of two stage multistage pump assembled by original reference impeller and optimal impeller. About 1.3% efficiency improvement was achieved at the design point. Additionally, The effective head of optimal multistage pump model was little lower than original model At the flow rate of 0.8QRef, however, the efficiency is still higher than original multistage pump model, This is because the input power of optimal multistage pump model decreased much. The comparison of streamline distributions by two stage multistage pump is shown in Fig. 12. From the result, it was clearly seen that there were recirculation flows existing near the shroud of impeller. The locations of recirculation flows were the same as the results shown in Fig. 10. Moreover, the intensity of recirculation flows in the second stage was much stronger. For the optimal multistage pump model, the streamline distribution was much smoother.
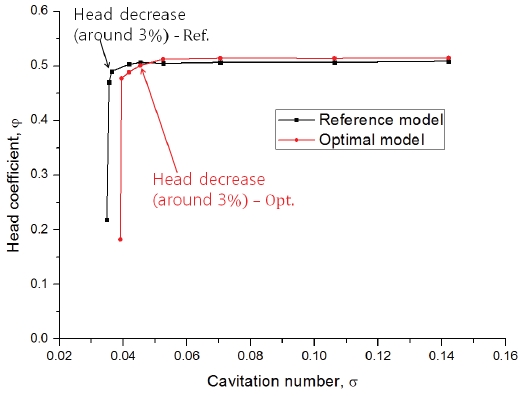
For the cavitation performance, only first stage was selected to conduct cavitation analysis. The cavitation performance comparison of reference and optimal models was presented in Fig. 13. It is known that around 3% head decrease means the cavitation inception. When the cavitation number decreased, the cavitation inception of optimal model was little earlier than reference model. This is because the optimal meridional shape is a little narrower. However, the pump model usually operates at the cavitation number of 0.142. From Fig. 13, it was seen that there was no cavitation inception.
6. Conclusion
In this study, a multi-objective optimization process based on numerical simulation for impeller meridional shape has been proposed by using DoE, RSM, and EA method.
- (1) Efficiency and effective head were selected as optimization objectives. The optimized result shows a better hydraulic performance at the flow rate of 0.8Qref, 1.0Qref and 1.2Qref than the original reference model.
- (2) The validity of the optimized result was verified by CFD analysis of the centrifugal pump model. The comparison of optimized model and original reference model showed that the optimized meridional shape can reduce the hydraulic energy loss and make the internal flow of impeller more smooth. Therefore, it can be proved that the optimization process is suitable and effective.
- (3) The impellers and continuous diffuser and return vanes also were assembled as a two stage multistage pump to validate the performance improvement. The performance was improved at various flow rates and the streamline distribution of optimal pump model was much smoother than reference model. Moreover, the cavitation performance was confirmed and there was no problem with the cavitation inception.
Acknowledgments
This work was supported by the Korea Evaluation Institute of Industrial Technology (KEIT) grant funded by the Korea government Ministry of Trade, Industry and Energy (No.10062074)
References
- S. Kim, Y. S. Choi, K. Y. Lee, and J. Y. Yoon, (2009), “Performance of Savonius Rotor for Environmentally Friendly Hydraulic Turbine”, International Journal of Fluid Machinery and System, 2(2), p6-12.
-
J. H. Kim, K. T. Oh, K. B. Pyun, C. K. Kim, Y. S. Choi, and J. Y. Yoon, (2012), “Design optimization of a centrifugal pump impeller and volute using computational fluid dynamics”, Proc. of 26th IAHR Symposium on Hydraulic Machinery and Systems, Lille, France.
[https://doi.org/10.1088/1755-1315/15/3/032025]

-
S. Miyauchi, (2004), “Optimization of meridional flow channel design of pump impeller”, International Journal of Rotating Machinery, 10(2), p115-119.
[https://doi.org/10.1155/s1023621x04000120]

-
R. Myers, D. Montgomery, and C. Anderson-Cook, (2009), “Response surface methodology: process and product optimization using designed experiments”, JohnWiley & Sons.
[https://doi.org/10.2307/1270613]

- T. Bäck, (1994), “Parallel Optimisation of Evolutionary Algorithms”, International Conference on on Evolutionary Computation, p418-427, Springer, Berlin.
- ANSYS Inc., ANSYS CFX Documentation, Ver. 18.1, http://www.ansys.com Accessed, 2018.
- ANSYS Optislang, ANSYS Optislang Documentation, Ver. 18.1, http://www.ansys.com Accessed, 2018.
- S. Zhen, and J. Panida, (2011), “Latin Hypercube Sampling Techniques for Power Systems Reliability Analysis With Renewable Energy Sources”, IEEE Transactions on Power Systems, 26(4), p2066-2073.
- J. Hu, M. Wang, M. Yu, and X. Li, (2011), “The drawing of the axial projection of the centrifugal pump impeller”, Journal of Chemical Equipment Technology, 32(2), p39-43, (In Chinese).

