Bellmouth Shape Optimization for the Suppression of Flow Instability in a Pump Sump Model
Abstract
The pump sump is usually used in the agricultural and industrial sectors to provide a uniform flow inlet for the pumping system. A suitable bellmouth (BM) design is necessary for the suppression of vorticity. The radius, elliptical, and spline design methods were selected to design the proper BM shape. Moreover, the parametric design of the BM shape was achieved with each design method. The optimization process was collaborated with the BM design methods to suppress flow instability in the pump sump. In this study, multi-objective optimization was used to minimize vorticity and maximize flow uniformity at the BM inlet. The optimal BM shape from the radius design method is preferable to other methods. The comparative study showed that optimal BM is effective in the suppression of vorticity than the initial one.
Keywords:
Bellmouth, Shape Optimization, Pump Sump, Swirl Flow, Vorticity키워드:
벨마우스, 형상 최적화, 펌프 흡수정, 선회 유동, 와도1. Introduction
The pump sump is widely used in the industrial and agricultural sectors because it is an integral component of the pumping system. The performance of the pumping system is directly related to the flow behavior in the pump sump. Hence, the stable flow should be maintained in the pump sump to reduce efficiency drop, cavitation, swirl flow, vorticity, noise, and vibration.(1,2) The proper design of the pump sump is a necessity for the stable operation of the pumping system. The poor intake design of the pump sump causes swirl flow in the pumping system.(3)
The pump sump design consists of a suction pipe and a sump.(4) The standards and guidelines for pump sump design are published by American National Standards Institution (ANSI),(5) the British Standards Institution (BSI),(6) the Japan Society of Mechanical Engineers (JMSE).(7) Generally, BM is the most common intake structure for the pump sump.(8) BMs are used to reduce the flow instabilities before entering into the pumping system.(9) However, many vortices exist in the pump sump, which causes swirl flow, cavitation, noise, and vibration.(10) The uneven flow distribution and large-scale turbulence are occurred in the pump sump.(11) The air-entraining vortices occur at the intake of the pump sump.(12)
Rajendran et al.(13) made a 3D turbulent flow analysis in the pump sump and compared it with the experimental results. Li et al.(14) observed velocity streamlines in the pump sump intake using Reynolds-Averaged Navier Stokes (RANS) equation. They concluded that the steady-state is unable to elaborate the flow in the pump intake. Nagahara conducted a PIV experiment and CFD analysis to visualize flow streamlines in the pump sump intake.(15) Tokyay and Constantinesu compared the flow structure in the pump sump by large eddy simulation (LES) and RANS models with PIV measurement.(16) They concluded that the LES model provides better predictions of the velocity, vorticity, streamline than the Shear Stress Transport model.(16) The LES approach is suitable for the unsteady flow prediction in the pump sump.(17) Bayeul et al.(18) also used a CFD commercial code to predict the flow behavior in the pump sump and study the flow characteristic of air entertainment by comparing multi-phase numerical study results with experimental investigations.
The proper intake design provides uniform swirl-free flow to the pumping system.(19) The anti-vortex device (AVD) is used to suppress vortex instability in the pump sump.20) Kim et al.(21) showed the effectiveness of AVD for the suppression of vorticity and turbulence kinetic energy. In this study, various design approaches were adopted for the proper parametric design of BM. The basic design process is incorporated with optimization to generate an optimized BM shape. Therefore, this study is aimed to suppress the flow instabilities like vorticities and swirl flow at the intake.
2. Design and Numerical Methodology
2.1 Design of bellmouth shape
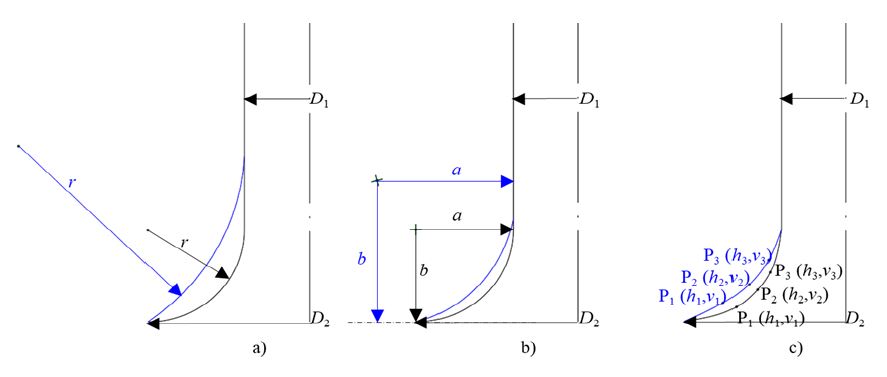
The BM shape is essential for the proper operation of the pump sump. The BM shape can be designed by using various techniques. This study adopted three design methods: a) radius method,(22) b) elliptical method,(22) and c) spline method.(23) Fig. 1 shows the design methods of BM using radius, elliptical, and spline methods. D1 and D2 are 50 mm and 100 mm, respectively.
In the radius method, the circular arc is used to make the BM shape. The BM shape is prepared by an ellipse in the elliptical. In the spline method, a spline curve is used to design the BM shape.
In the radius method, the radius of curvature is considered as the design parameter. Fig. 1 a) indicates the arc radius r is used to embody the BM shape. Similarly, in the elliptical design method, an ellipse is used to make the BM shape, whose design parameters are major and minor radii. Fig. 1 b) indicates that a and b are major and minor radii of the ellipse, respectively. In the spline method, the three spline points are used to make the BM shape. Thus, the horizontal and vertical coordinates are considered as the design parameters. Fig. 1 c) shows that points P1, P2 and P3 are used to create the spline curve. The coordinate of these spline points was used as design parameters for BM from the spline method.
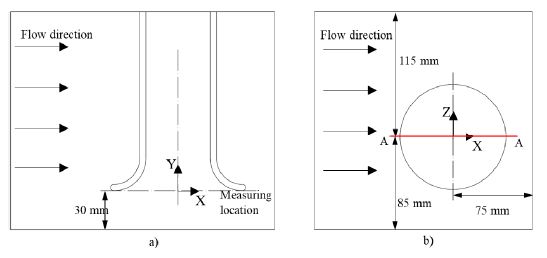
The initial design of BM was adopted from the previous studies.(24-26) The initial BM shape design is based on the radius method. Fig. 2 indicates the 2D view of the pump sump model and measurement location. The same BM position and diameters are used for the optimization.
The initial BM shape is prone to the vortex core and swirl flow. In this study, the BM shape optimization was performed to suppress the vortex core.
2.2 Numerical Methodology
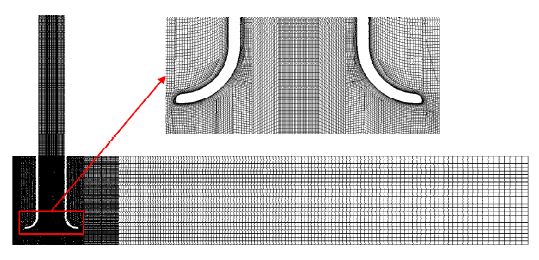
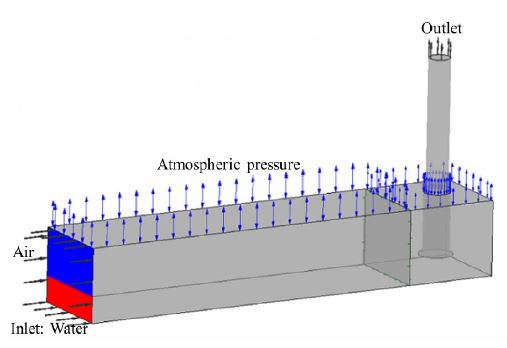
CFD analysis is used to investigate the flow behavior in the pump sump. ANSYS CFX 19.2(27) was used to conduct CFD analysis. The structured grids were generated using ANSYS ICEM 19.2(27) and shown in Fig. 3. Fig. 4 illustrates the boundary conditions for pump sump analysis. The red and blue colors represent the water and air, respectively. The upper section of the pump sump is subject to atmospheric pressure. The unsteady internal flow in the pump sump is changing according to the CFD methods. The various models were selected to illustrate the internal flow behavior in the pump sump. The average y+ value for the BM is less than 5. Therefore, the numerical grids are suitable for the CFD analysis. Boundary conditions were adopted from previous studies,(23,26) which is illustrated in Table 1. The instantaneous results at 10 sec were used to observe the vortex at the BM inlet.
The vorticity illustrates the flow field in the BM inlet. It is defined as the curl of the flow velocity (u), and the definition can be expressed as in Eq. (1).
| (1) |
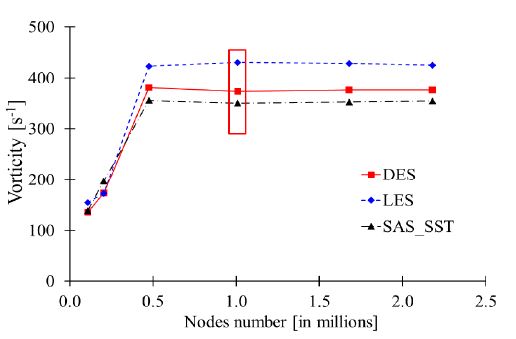
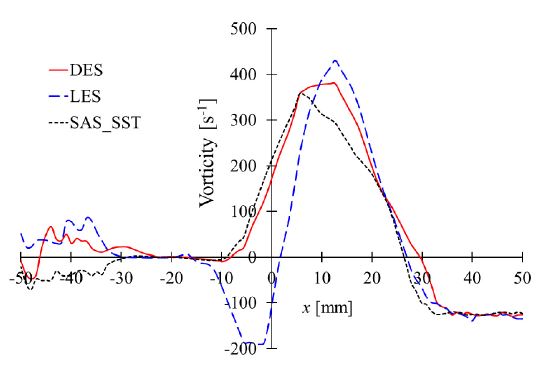
The mesh dependency test was conducted as shown in Fig. 5, and 1 million nodes are suitable for DES, LES, and SAS-SST analysis method Fig. 6 shows vorticity distribution in the BM at line AA. The maximum vorticity in the BM inlet is 400 s.-1 The swirling strength (λ) is the excellent vortex indicator in the wall turbulence.(28)
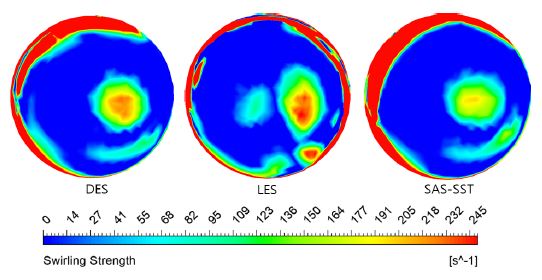
Fig. 7 shows the swirling strength comparison among various methods. Finally, LES was selected to optimize and visualize the internal flow in BM.
3. Optimization Methodology
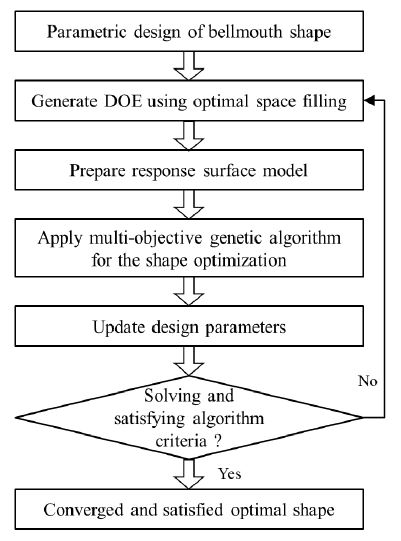
Fig. 8 shows the flow chart for the BM shape optimization process. The optimization flow chart explains the process required to perform optimization. The parametric design of the BM shape was achieved by various design methods. The surrogate model was prepared, which predicts the objective functions with a change in design variables. The precise surrogate model was selected based on the goodness of fit.(29) The multi-objective genetic algorithm(29) was used to obtain the optimal shape for the BM. Finally, the optimal solution was verified by CFD analysis. Hence, the optimal BM shape will be achieved.
3.1 Parametric design of BM
The parametric design of BM is varied with design methodology. The parametric design of the BM shape with radius, elliptical, and spline methods was shown in Eqs. (2), (3), and (4), respectively.
| (2) |
| (3) |
| (4) |
where r is the arc radius of BM curve, a is the major radius and b is the minor radius of the ellipse, hi and vi are horizontal and vertical coordinates for spline points at ith location from the center axis, respectively.
3.2 Surrogate modeling
Surrogate modeling is an essential part of the optimization process. The surrogate model is the approximation model used to predict the objective function with a change in design parameter values. The preparation of the surrogate model is highly dependent on the design of experiments (DOE). Therefore, the optimal space-filling method(29) was selected to generate DOE within the design space. The bound values for design parameters are shown in Table 2. The design space is considered to satisfy the limitation of BM shape and pump sump design.
Recently, numerous techniques are available for the generation of the surrogate model. The methods like genetic aggregation (GA),(30) Kriging (KG),(31) radial basis function (RBF),(32) non-parametric regression (NPR),(33) neural network (NN)(34) are available to prepare the surrogate model. Among these methods, GA was selected to formulate the explicit surrogate model.(29) The surrogate model reduces the computational cost and time. It can interpolate numerous design points for the optimization process. Hence, an accurate surrogate model will provide a precise approximation between design variables and objective functions.
3.3 Optimization Algorithm
The optimization formulation for the BM shape optimization is shown in Eq. (5).
| (5) |
where Su is the flow uniformity, ωn is the vorticity, di is the design parameter varying according to the design method, superscript L and U are lower and upper bound of design parameters.
Flow uniformity is defined as the deviation between local and average flow velocity in the specified cross-section area. It is calculated by using Eq. (6).
| (6) |
where u is the local velocity, u is the average flow velocity, A is the cross-sectional area.
The flow uniformity and vorticity are measured at the BM inlet. The multi-objective genetic algorithm (MOGA) was used to optimize the BM shape. The setting criteria for MOGA were adopted from the previous study,(29) which is indicated in Table 3.
4. Results and Discussion
4.1 Optimal BM shape
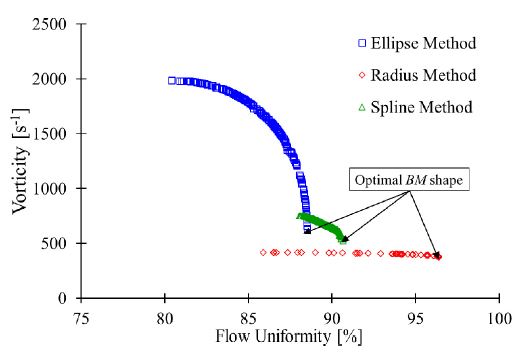
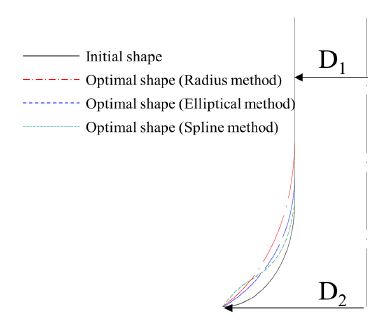
The Pareto front is used to obtain the optimal design based on design criteria. The vorticity and flow uniformity were chosen to prepare the Pareto front. The vorticity and flow uniformity were measured on the line AA. The Pareto front indicates the trade-off between vorticity and flow uniformity in the BM. Pareto fronts from various design methods are compared in Fig. 9. The optimal BM shape from the radius method is preferable for the vortex suppression in the BM. Fig. 10 indicates optimal BM shape comparison generated by radius, elliptical, and spline design methods.
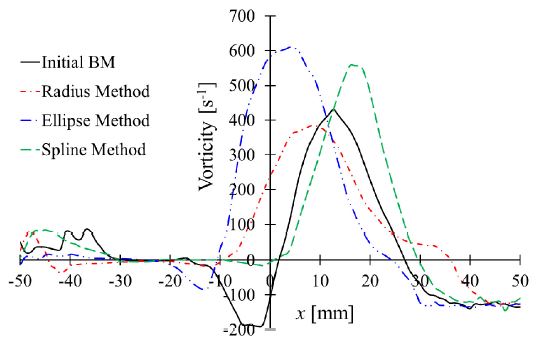
The optimal BMs were selected from various design methods. Fig. 11 shows a vorticity comparison between initial and optimal BM shapes from various design methods. The change of vorticity from negative to positive value indicates the direction change of vortex in the initial BM shape. Moreover, the magnitude of vorticity in the BMs with radius, elliptical, and spline methods are 315 s-1, 610 s-1, and 560 s-1, respectively. The optimal BM shape from the radius method has minimum vorticity compared to other design methods.
Vorticity comparison between initial and optimal BM shapes with a) radius b) elliptical and c) spline methods
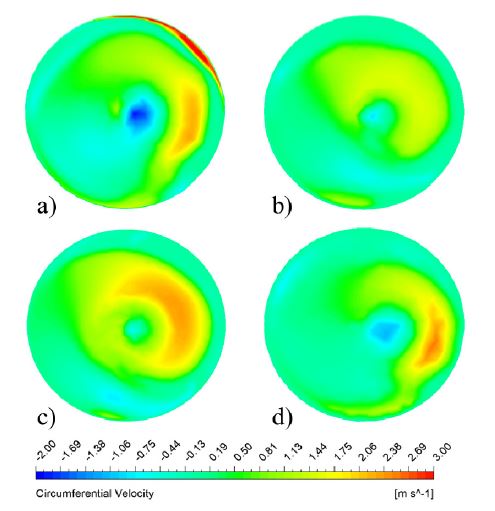
Fig. 12 shows the circumferential velocity contours in the initial and optimal BM shape. The eccentric and negative velocity movement is visible in the initial BM shape. The negative circumferential velocity is the cause of negative vorticity in the initial BM, as shown in Fig. 11. The BM shape optimization successfully suppressed the negative velocity distribution at the BM inlet. The BM designed by the elliptical and spline method showed a larger negative velocity zone compare to the radius method. The difference in positive and negative velocity zone is the cause for the swirl flow and vortex formation in the BM. The circumferential velocity distribution is more uniform in the optimal BM by radius method than other BM shapes, which reduces the vorticity strength. The proper BM designed is required to suppress swirl flow and vortex instability in the pumping system. Therefore, the optimal BM shape from the radius method was selected.
4.2 Comparison between initial and optimal BM shapes
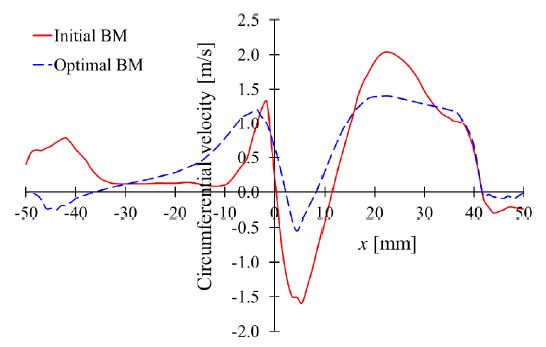
The optimal BM shape was prepared by the radius method. A detailed flow behavior comparison between initial and optimal BM shapes was accomplished. Fig. 11 shows the possibility of the vortex in the BM. The optimal BM reduces the vorticity from 423 s-1 to 315 s-1. Therefore, the optimization of BM suppresses the vortex strength in the pump sump. Fig. 13 shows the comparison between circumferential velocity in the BM shape. The sharp circumferential velocity drop indicates the strong vortex in the proximity of the BM center. The magnitude of negative circumferential velocity is decreased from 1.51 m/s to 0.55 m/s with the optimal BM shape. Moreover, the optimal BM shape helps to recover the steep fall in the circumferential velocity. Eventually, the vortex strength is suppressed by the optimal BM shape installation.
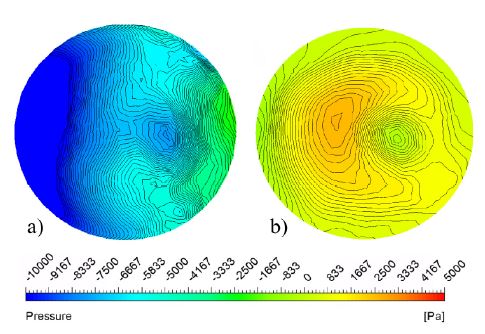
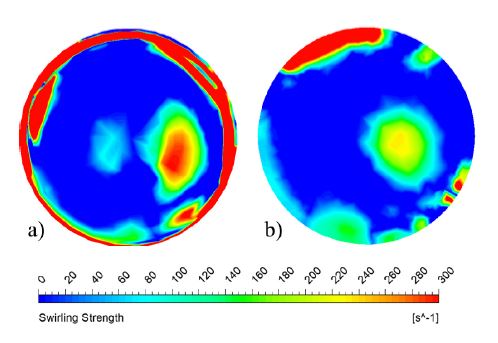
Furthermore, qualitative analyses were used to visualize the swirl flow and vortex instability in the BM. Fig. 14 illustrates the pressure contours comparison in the initial and optimal BM shape. The pressure contours indicate a large negative static pressure zone in the initial BM shape, which leads to cavitation, noise, and vibration. The optimal BM shape recovers the negative pressure in the BM inlet. Fig. 15 represents the swirling strength in the BM. At the vortex center, the swirling strength is comparatively higher than in other locations. It implies that the suppression of swirling strength will reduce the vortex strength in the BM. Fig. 15 shows that the optimal BM shape reduces the swirling strength at the vortex core and in the inner edge of the optimal BM shape.
The comparison between initial and optimal BM shapes is shown in Table 4. The flow uniformity is increased from 62.85 % to 96.28 % in the optimal BM inlet. The installation of optimal BM reduced the swirling strength from 431 s-1 to 104 s-1. The average static pressure changed to a positive value in optimal BM shape, compared to the initial BM shape. The higher flow uniformity indicates that the difference in the average and local flow velocity is minimum.
The optimal BM shape improved the flow uniformity and suppressed the swirling strength significantly at the BM inlet. Hence, the optimal BM is effective in the suppression of the vortex instability in the pump sump.
5. Conclusions
The vortex instability in the pump sump intake is dependent on the BM shape. The radius, elliptical, and spline design techniques were selected to design the BM shape. The radius, elliptical, and spline design methods are one design variable, two design variables, and six design variables optimization problems, respectively. The BM shape design with the spline method is a high-dimensional problem compare to other design methods. The design of BM is highly complicated with the spline method.
The flow uniformity and vorticity were selected as the performance measures for the BM shape optimization. The optimal BM shape is obtained from each design approach. The Pareto front and CFD analyses showed that the radius method is suitable for the BM shape design. Therefore, the optimal BM shape was selected from the radius design method.
The comparison between initial and optimal BM shapes was carried out. The flow uniformity was increased from 62.85% to 96.28% with the installation of optimal BM shape. The vorticity was decreased from 4340 s-1 to 730 s-1. The optimization of the BM shape reduced the vortex instability at the BM inlet. The static pressure was increased drastically in optimal BM shape compare to the initial one. Hence, the cavitation possibility was minimized with the installation of an optimal BM shape. Therefore, the effective suppression of cavitation, swirl flow, and vorticity is possible from the optimal BM shape installation.
References
-
Cheng, L. and Liu, C., 2009, “Research on the Design Process of Bellmouth Suction Passage of Vertical Pumping System” Fluids Engineering Division Summer Meeting, vol 43727, p 237-242.
[https://doi.org/10.1115/FEDSM2009-78207]

-
Choi, J., Choi, Y-D., Kim, C-G. and Lee, Y-H., 2010, “Flow uniformity in a multi-intake pump sump model” Journal of Mechanical Science and Technology, Vol 24, No. 7, pp. 1389-1400.
[https://doi.org/10.1007/s12206-010-0413-5]

-
Arboleda, G. and El-Fadel, M., 1996, "Effects of approach flow conditions on pump sump design", J Hydraulic Eng, Vol. 122, No. 9, pp. 489-494.
[https://doi.org/10.1061/(ASCE)0733-9429(1996)122:9(489)]

-
Chuang, W., Hsiao, S. and Hwang, K., 2014, “Numerical and experimental study of pump sump flows”, Mathematical problems in engineering, Vol. 2014, 735416.
[https://doi.org/10.1155/2014/735416]

- American National Standards Institute, 1998, “American national standard for pump intake design. Hydraulic Institute”.
- British Standards Institution, 2009, “Rotodynamic pumps, Design of pump intakes. Recommendations for installation of pumps (PD CEN/TR 13930:2009)”.
- Japan Society of Mechanical Engineers, 1984, “Standard method for model testing the performance of a pump sump (JSME S 004)”.
-
Hashid, M., Hussain, A. and Ahmad, Z., 2015, “Discharge characteristics of lateral circular intakes in open channel flow”, Flow Measurement and Instrumentation, vol. 46, pp. 87-92.
[https://doi.org/10.1016/j.flowmeasinst.2015.10.005]

-
Kanda, H. and Oshima, K., 1998, “Numerical study of effects of a bellmouth on the entrance pipe flow”, Sixteenth International Conference on Numerical Methods in Fluid Dynamics, Springer, pp. 67-72.
[https://doi.org/10.1007/BFb0106563]

-
Qian, Z-D., Wu, P., Guo, Z. and Huai, W-X., 2016, “Numerical simulation of air entrainment and suppression in pump sump” Science China Technological Sciences, Vol. 59, No. 12, pp. 1847-1855.
[https://doi.org/10.1007/s11431-016-0237-8]

-
Sweeney, C. E., Elder, R. A. and Hay, D., 1982, “Pump sump design experience: summary”, Journal of the Hydraulics Division, Vol. 108, No. 3, pp. 361-377.
[https://doi.org/10.1061/JYCEAJ.0005835]

-
Möller, G., Detert, M. and Boes, R. M., 2015, “Vortex-induced air entrainment rates at intakes”, Journal of Hydraulic Engineering, Vol. 141, No. 11, 04015026.
[https://doi.org/10.1061/(ASCE)HY.1943-7900.0001036]

- Rajendran, V. P., 1998, “Experiments on flow in a model water-pump intake sump to validate a numerical model”, Proceedings of FEDSM’98, FEDSM98-5098, June 21-25, Washington, DC.
-
Li, S., Lai, Y., Weber, L., Silva J. M. and Patel, V. C., 2004, “Validation of a three-dimensional numerical model for water-pump intakes”, Journal of Hydraulic Research, Vol. 42, No. 3, pp. 282-292.
[https://doi.org/10.1080/00221686.2004.9641196]

- Nagahara, T., Sato, T., Okamura, T. and Iwano, R., 2003, “Measurement of the Flow around the Submerged Vortex Cavitation in a Pump Intake by Means of PIV”, In: Anonymous Fifth International Symposium on Cavitation, Cav03-OS-6-011, Osaka, Japan,
-
Tokyay, T. E. and Constantinescu, S. G., 2006, “Validation of a large-eddy simulation model to simulate flow in pump intakes of realistic geometry”, Journal of Hydraulic Engineering, Vol. 132, No. 12, pp. 1303-1315.
[https://doi.org/10.1061/(ASCE)0733-9429(2006)132:12(1303)]

-
Yamade, Y., Kato, C., Nagahara, T. and Matsui, J., 2020, “Suction Vortices in a Pump Sump—Their Origin, Formation, and Dynamics”, Journal of Fluids Engineering, Vol. 142, No. 3, 031110-1.
[https://doi.org/10.1115/1.4045953]

-
Bayeul-Lainé, A., Simonet, S., Bois, G. and Issa, A., 2012, “Two-phase numerical study of the flow field formed in water pump sump: influence of air entrainment”, IOP Conference Series: Earth and Environmental Science, Vol 15, 022007.
[https://doi.org/10.1088/1755-1315/15/2/022007]

- Shukla, S. N. and Kshirsagar, J. T., 2008, “Numerical Simulation of Drawdown in Pump Sumps”, 4th International Symposium on Fluid Machinery and Fluid Mechanics, 4ISFMFE-Ab11, Beijing, China..
-
Norizan, T. A., Reda, E. and Harun, Z., 2018, “Enhancement of vorticity reduction by floor splitter in pump sump to improve pump efficiency”, Sustainable Energy Technologies and Assessments, Vol. 26, pp. 28-36.
[https://doi.org/10.1016/j.seta.2017.06.001]

-
Kim, C-G., Choi, Y-D., Choi, J-W. and Lee, Y-H., 2012, “A study on the effectiveness of an anti vortex device in the sump model by experiment and CFD”, IOP conference series: Earth and Environmental Science, Vol. 15, 072004.
[https://doi.org/10.1088/1755-1315/15/7/072004]

- Blair, G. P. and Cahoon, W. M., 2006, “Special investigation: design of an intake bellmouth”, Race Engine Technology, Vol. 17, pp. 34-41.
- Guo, M., Chen, Z., Vu, V. L., Shrestha, U. and Choi, Y-D., 2019, “The effect of bell mouth shape on the internal flow characteristics in pump sump”, 2nd IAHR-Asia Symposium on Hydraulic Machinery and Systems, IAHR-Asia 2019-WeA2-3, Busan, Korea.
-
Lee, Y-B., Kim, K-Y., Chen, Z. and Choi, Y-D., 2015, “The effect of suction pipe leaning angle on the internal flow of pump sump”, Journal of Advanced Marine Engineering and Technology, Vol. 39, No. 8, pp. 849-855.
[https://doi.org/10.5916/jkosme.2015.39.8.849]

-
Lee, Y-B., Kim, K-Y., Chen, Z. and Choi, Y-D., 2017, “The effect of pump intake leaning angle and flow rate on the internal flow of pump sump”, The KSFM Journal of Fluid Machinery, Vol. 20, No. 1, pp. 74-80.
[https://doi.org/10.5293/kfma.2017.20.1.074]

-
Guo, M. and Choi, Y-D., 2019, “The influence of water level and flow rate on vortex occurrence in pump sump”, Journal of Advanced Marine Engineering and Technology, Vol. 43, No. 2, pp. 102-107.
[https://doi.org/10.5916/jkosme.2019.43.2.102]

- ANSYS, ANSYS CFX Documentation, ANSYS. Inc, Pennsylvania, (2018).
-
Chen, H., Li, D., Bai, R. and Wang, X., “Comparison of swirling strengths derived from two-and three dimensional velocity fields in channel flow”, AIP Advances, Vol. 8, No. 5, 055302 .
[https://doi.org/10.1063/1.5023533]

-
Shrestha, U. and Choi, Y-D., 2020, “A CFD-Based Shape Design Optimization Process of Fixed Flow Passages in a Francis Hydro Turbine”, Processes, Vol. 8, No. 11, pp. 1392.
[https://doi.org/10.3390/pr8111392]

-
Wang, S., Jian, G., Xiao, J., Wen, J. and Zhang, Z., 2017, “Optimization investigation on configuration parameters of spiral-wound heat exchanger using Genetic Aggregation response surface and Multi-Objective Genetic Algorithm”, Applied Thermal Engineering, Vol. 119, pp. 603-609.
[https://doi.org/10.1016/j.applthermaleng.2017.03.100]

-
Liu, H. and Maghsoodloo, S., 2011, “Simulation optimization based on Taylor Kriging and evolutionary algorithm”, Applied Soft Computing, Vol. 11, No. 4, pp. 3451-3462.
[https://doi.org/10.1016/j.asoc.2011.01.017]

-
Amouzgar, K. and Strömberg, N., 2017, “Radial basis functions as surrogate models with a priori bias in comparison with a posteriori bias”, Structural and Multidisciplinary Optimization, Vol. 55, No. 4, pp. 1453-1469.
[https://doi.org/10.1007/s00158-016-1569-0]

-
Wang, Q., 2006, “Non-parametric regression function estimation with surrogate data and validation sampling”, Journal of Multivariate analysis, Vol. 97, No. 5, pp. 1142-1161.
[https://doi.org/10.1016/j.jmva.2005.05.008]

-
Melo, A. P., Cóstola, D., Lamberts, R. and Hensen, J. L. M., 2014, “Development of surrogate models using artificial neural network for building shell energy labelling”, Energy Policy, Vol. 69, pp. 457-466.
[https://doi.org/10.1016/j.enpol.2014.02.001]

