Effect of Suction Head on Inception and Development of Cavitation in a Francis Turbine Model
Abstract
Francis turbine is one of the highly efficient turbines which converts hydraulic energy to mechanical energy. At lower flow rate operating conditions, the turbine’s stable operation is affected due to the downstream swirl instabilities. Cavitation is also a very common and severe problem in these turbines due to which turbine components may fail because of erosion and pressure fluctuations. In the turbine, the suction head affects the cavitation’s inception and development. A numerical investigation of the effect of suction head on cavitation at part load condition is attempted in the present study using CFX code. The suction head is evaluated based on creating different suction pressure at the draft tube outlet. The steady-state numerical calculations are performed with a structured and unstructured grid. For the acceptance of generated grid, the grid convergence index is also calculated. Reynolds averaged Navier-Stokes (RANS) equations are solved accompanying the Rayleigh-Plesset model to capture the turbulent flow with cavitation. An experiment is also performed for the verification of the numerical results. As the suction head increases, the cavitation is initiated and developed and both the efficiency and power decrease. The head loss in the draft tube is maximum for fully developed cavitation with a 2% deviation from without cavitation case for which the loss is minimum. The vortex rope strength for the higher values of suction heads is higher compared to lower values of suction heads. Similarly, the swirl intensity is also higher for higher suction heads. The deciding parameter of the suction head can be predicted for the stable operation of the turbine using the current investigation.
Keywords:
Francis turbine, Cavitation, Draft tube, Swirl instability, Suction head키워드:
프란시스 수차, 캐비테이션, 흡출관, 선회 불안정성, 흡입 헤드1. Introduction
Francis turbines, which are essentially reaction turbines, are best suited to hydropower plants because of their high-efficiency conversion. Hydropower plants can address the electric needs of remote and isolated places, and these facilities do not cause deforestation or resettlement concerns. These features make hydropower plants an appealing renewable energy source. The management of these plants is critical for ensuring maximum efficiency over time. The maximum efficiency is only achieved at the best efficiency point (BEP) but the turbine hardly operates at this point.(1) Turbines exhibit a decline in performance after a few years of operation due to a variety of factors such as off-design operating conditions, silt erosion, cavitation, corrosion, and fatigue.
At part load (PL) operating condition, vortex rope is generated inside the d raft tube ( DT) of the turbine which contributes to the downstream swirl instabilities which in turn induces the pressure pulsation.(2) The turbine may go through structural failure due to resonance. If liquid flows into a zone where the pressure is decreased to vapour pressure, the liquid boils and bubbles form locally. When these bubbles reach areas of higher pressure, they burst rapidly, this phenomenon is referred to as cavitation.(3) When such collapse occurs repeatedly and at a high frequency near solid walls, it produces intense pressure pulses. The material in that area is harmed as a result of solid surface pitting. It results in noise, vibration in the draft tubes and on the trailing edge of turbine blades, as well as a reduction in efficiency.(4) The Thoma cavitation coefficient (σ) or Thoma plant factor (σP) is a cavitation number used to determine the region where cavitation occurs in the turbines. It is expressed as;(5)
| (1) |
Where, Ha, Hν , Hs and H are atmospheric pressure head, vapour pressure head, suction head and working head of the turbine respectively. For the turbine to operate without cavitation, the σ must be greater than the critical value.(3) Cavitation is impossible to eliminate, however, it can be mitigated and decreased to tolerable levels.
The runner design has an obvious impact on the cavitation phenomenon, but two other major factors influence its onset and development: the suction head and off-design conditions.(6) Cavitation is a complex flow phenomenon that cannot be prevented when operating outside of design parameters. Traditionally, cavitation research has relied solely on experimental model testing, which is notoriously difficult and time-consuming and expensive. The rapid development of CFD (Computational Fluid Dynamics) with computational capacity and complete graphics plays a critical role in undertaking inner flow field evaluations early in the design phase. CFD is a cost-effective and an accurate alternative to model testing, with simulation variants conducted quickly, which has obvious benefits. Because of their superiority in physical modelling and computational capabilities for the cavitation problem, techniques of cavitation simulation based on the Navier-Strokes equation have gotten a lot of attention.(7, 8)
It can be concluded from the literature survey that the cavitation phenomenon in the Francis turbine depends on the operating condition and the suction heads and the numerical methodology can be utilized to predict the cavitation phenomenon accurately. Hence the present study investigates numerically the effect of suction head variation on the inception and development of cavitation at PL operating condition inside the Francis turbine. The safe working range for the turbine’s stable operation is obtained. Since the DT is the last component of the turbine which is the centre for the PL and cavitation induced instabilities, the internal flow physics of the DT flow is thoroughly studied. Using the steady-state approach, the turbulent flow equations are solved in the form of Reynolds averaged Navier-Stokes (RANS) equations with Shear stress transport (SST) turbulent model. A two-phase mixture model is also employed for the prediction of the cavitation phenomenon. The experimentation is also performed based on the IEC 60193 standards for numerical validation.
2. Francis turbine model and mesh generation
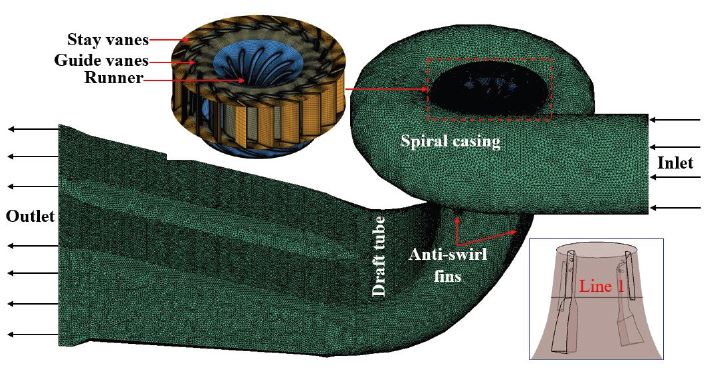
The present numerical study utilizes the Francis turbine model consisting of five components; spiral casing, stay vanes, guide vanes, runner and DT. The incoming flow enters the spiral casing which provides circulatory motion to the fluid with maintaining its high pressure. The swirl content is reduced via stay and guide vanes which also guide the flow towards the runner. The runner converts the high pressure of the fluid to the torque and directs it to the DT. The DT transforms the remaining kinetic energy of the water into static pressure. For better pressure recovery two diffusers are incorporated into the geometrical model. Since at PL condition the downstream swirl instabilities induce so to suppress these, four anti-swirl fins are mounted on the DT wall. The turbine model also consists of four air injection holes located at each fin but the air injection is restricted in the current investigation. The Francis turbine specifications are tabulated in Table 1.
The specific speed in Table 1 mathematically can be expressed in eq. (2) and the unknown terms can be found in ref. (5);
| (2) |
The numerical study utilizes grid points on which the physical equations are solved, so the computational domains are generated with structured and unstructured grids for different parts of the turbine. Table 2 shows the type of mesh for the individual components and software through which these grids are generated. The three-dimensional geometrical model of the turbine with generated mesh is shown in Fig. 1. Line 1 is the line inside the DT for which flow velocity and swirl intensity is calculated. As the runner is the rotational component of the turbine so it’s y+ value is kept below 5. The present study employs the various suction pressure at the DT outlet for the cavitation development so the DT model is generated with grids having a value less than 80 so that accurate flow physics of the DT could be found.
The accuracy of the numerical results depends upon the quality of the mesh so a widely accepted mesh independence study is performed. In this method, three meshes are generated with fine, medium and coarse element count sizes. Discretization error in the form of Grid convergence index (GCI) is calculated for all the meshes for two variables; normalized efficiency and discharge factor (QED) at BEP condition which are tabulated in Table 3.(9) The fine grids show a GCI value of less than 1% which is lower than the limiting value so the fine mesh is used for further calculations. The unknowns in Table 3 can be found in ref. (9).
3. Numerical modeling and boundary condition
The downstream severity occurs for the range of flowrate (Q) ratio (Q/QBEP) between 0.5 to 0.85.(2, 10) Hence, in the present study, the PL operating condition is set with a guide vane angle of 16° for which Q/QBEP = 0.74. The cavitation is induced inside the turbine at this operating condition by changing the suction pressure at the DT outlet. The current study is performed for five suction head values. At these operating conditions, an experiment is also performed that visualizes the cavitation. According to the experiment at Hs/H = 0.311 the onset of cavitation is observed because of which this point is called cavitation inception point. Before and after this value of suction head cavitation does not occur and fully developed cavitations are observed respectively. Table 4 shows the operating conditions of the turbine model. The suction head is normalized using the effective head of the turbine. The definition of the coefficients that appeared in Table 4 can be referenced in ref. (5).
The numerical solution is achieved using ANSYS-CFX. The turbulent equations of the flow physics are solved using the steady-state approach in the form of RANS equations.(11) The unknown Reynolds stress of the RANS equations is modelled using the SST turbulent model which gives an accurate solution for the simulation of turbo-machines.(12, 13) The present study explores the cavitation phenomenon so to accurately predict this natural phenomenon a two-phase mixture model named the Rayleigh-Plesset model is employed.(14, 15)
ANSYS-CFX used the control volume technique to solve the differential equations. The space discretization is carried out by a high-resolution scheme and the turbulence numerics are of the first-order.(1) The components of the turbine are connected through interfaces. With 5% turbulent intensity General grid interface (GGI) is used to cope with the variation in the y+ values. The rotating and stationary interfaces are coupled using a stage (mixing plane) interface. Water and vapour at 25℃ are considered as working fluids. The steady cavitating flow is solved by initializing through steady non-cavitating solutions. For the better convergence residual of value 10-6 is considered. Under the cavitation condition, the volume fraction of water is taken as 1 while the volume fraction of vapour is 0.
4. Results and discussions
4.1 Numerical validation
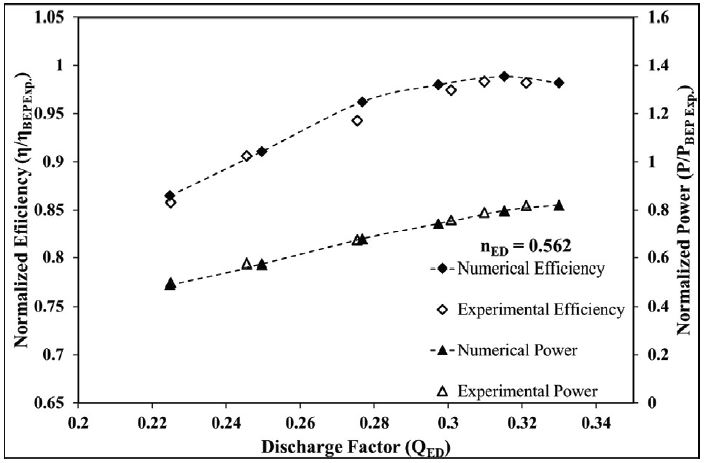
For validation of the numerical methodology, an experiment is performed fulfilling the norms of standard IEC 60193. Figure 2 shows verification of the hydraulic performance of the turbine model with the experimental results at nED = 0.562. The efficiency and power are non-dimensionalized using BEP values. As can be seen from this figure, for the variation of discharge factor from guide vane angle 16° to 26° both the performance parameters are matching well with the experimental results. As QED increases, the efficiency increases and reaches a maximum value from where it starts decreasing for further increments in QED.
4.2 Hydraulic performance
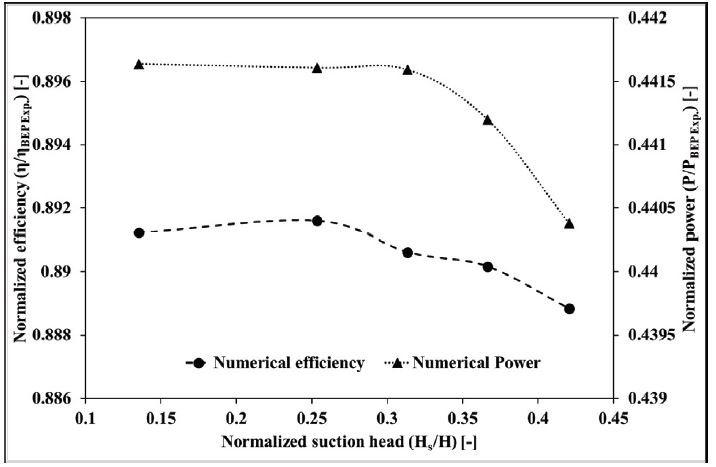
The cavitation phenomenon with the suction pressure variation not only affects the internal flow characteristics but also the hydraulic performance of the turbine. For the variation of suction heads, the steady-state calculated efficiency and power are presented in Fig. 3. The parameters are normalized using efficiency and power calculated at the BEP condition during the experiment. The suction head is non-dimensionalized by the working head of the turbine at PL condition. Both efficiency and power are showing an insignificant difference for the lower values of the suction heads which belong to without cavitation cases. From the cavitation inception point, the efficiency starts decreasing and obtained a minimum value for the fully developed cavitation at Hs/H = 0.420. The generated power is also reduced for the cavitating flows and minimum value is exhibited at Hs/H = 0.420. Hence, the numerical results are showing that at PL condition for suction heads correspond to without cavitation, the performance parameters do not get affected while as the cavitation is induced with higher values of suction heads both the parameters get reduced significantly.
At the lower flow rate condition, the DT losses are more compared to the other components of the turbine.(16) So, the head loss inside the DT is also calculated in the present study so that the efficiency variation with the suction head could also be verified. The head loss is calculated as;(17)
| (3) |
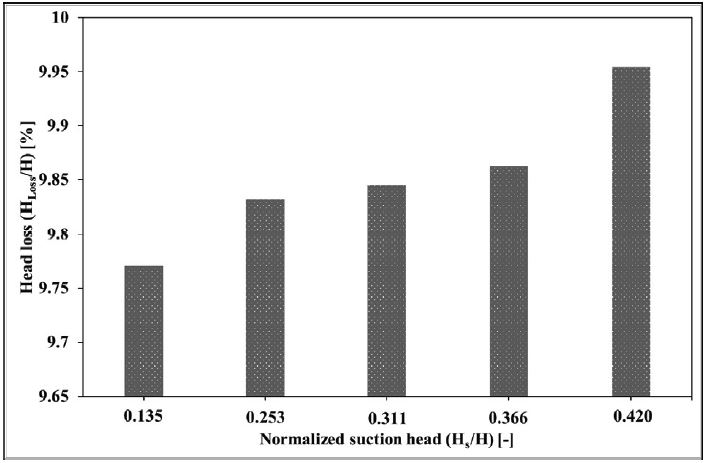
Where Δp is the pressure difference between the inlet and outlet of the DT, ρ is the fluid’s density and g is the gravitational acceleration. For the five suction heads, the head loss is presented in Fig. 4. It is clearly observed that at Hs/H = 0.135 and 0.253, the DT losses are exhibiting lower values. However, the losses are more for higher values of Hs/H as the cavitation is induced. The maximum head loss is achieved for Hs/H = 0.420. The difference between head loss at Hs/H = 0.135 and 0.420 is about 2%. The higher losses are justifying the decrease in the efficiency in Fig. 3.
4.3 Draft tube flow characteristics
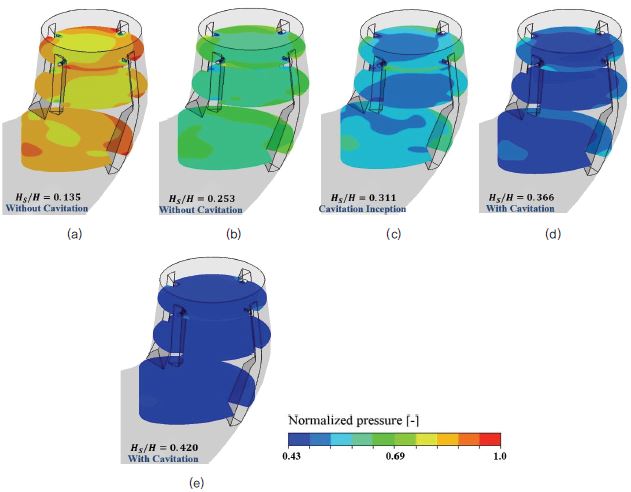
The downstream swirl instabilities are induced at PL condition because of the vortex rope formation which in turn favours high-pressure pulsation. Cavitation can be developed at the low-pressure zones of the vortex rope inside the DT which enhances its strength called cavitating vortex rope.(18) To suppress the DT surge due to this cavitating vortex rope, stabilizer fins are installed at the DT wall. Even with the fins, the cavitating vortex rope can not be eliminated. Since the cavitation depends on the suction head so to investigate the vortex rope, Iso-pressure surface distributions are plotted for various suction heads in Fig. 5. The boundary value for the Iso-surfaces is equal to the saturation pressure of the water so that these plots can accurately predict the cavitating vortex rope. For without cavitation cases the Iso-pressure surfaces are not generated showing stable operating conditions for the turbine. At the inception point, the Iso-surfaces are induced but attached only to the fin’s surfaces but the formation of the vortex rope is still restricted which indicates that the vapour bubble formation is initiated. For the normalized suction heads, 0.366 and 0.420, a proper form of vortex rope can be observed which validates the condition of cavitation. As the suction heads are increased strength of the vortex rope is also increased with maximum strength at Hs/H = 0.420.

Iso-surface of pressure distributions at (a) Hs/H = 0.135, (b) Hs/H = 0.253, (c) Hs/H = 0.311, (d) Hs/H = 0.366, and (e) Hs/H = 0.420
To investigate the cavitation inception and development numerically vapour volume fractions in the form of Iso-surfaces are also plotted for various suction heads in Fig.6. The boundary value for the fraction is set at 10-6, since the flow domain is quite big compared to the vapour volume. As expected for without cavitation calculations vapour bubble formation is absent for the whole domain. The bubble formation initiates with the inception point as shown in Fig. 6(c) but t he v apour quantity i s very l ow concentrated to the runner blades only. With further increase in suction heads, vapour formation takes place in runner blades as well as in the DT but near the air injection holes only. The maximum vapour formation is taking place at Hs/H = 0.420 in Fig. 6(e). Hence the numerical results are justifying the information obtained through the experiment.
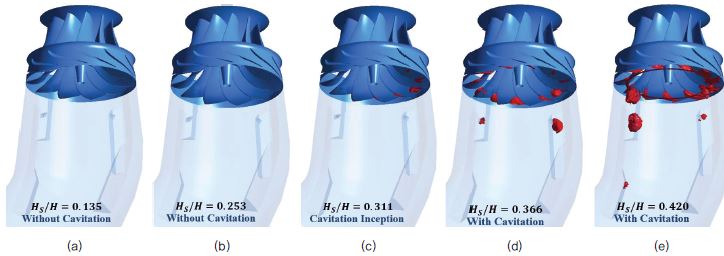
Iso-surface of vapour volume fraction at (a) Hs/H = 0.135, (b) Hs/H = 0.253, (c) Hs/H = 0.311, (d) Hs/H = 0.366, and (e) Hs/H = 0.420
The static pressure calculation is an essential tool to predict vortex rope formation. In the present study, the vortex rope plots are also complemented through pressure contours at several sections of the DT for different suction heads as shown in Fig. 7. Three monitoring planes are selected in the DT flow direction which is located at 0.2 D, 0.6 D and 1.2 D from the DT inlet respectively. The pressure is normalized using the maximum pressure which is obtained at Hs/H = 0.135. The minimum value of legend is selected as the saturation pressure of water vapour so that the vortex rope could be verified accurately. For all the values of the suction heads, higher pressure has occurred at the plane located at 1.2 D compared to the other planes. All the cases exhibit a combination of lower and higher pressures near the air injection hole location because of which flow complexity is induced near this location. Among all the three planes higher areas of low-pressure zones are found at the plane located at 0.6 D for all the cases. For without cavitation, the low-pressure values are greater than the minimum pressure due to which these cases do not allow the vortex formation (Fig. 5(a) and (b)). At the cavitation inception point, the lowest pressure is observed at the fin’s surfaces but not at the DT centre due to which the Iso-pressure surface in Fig. 5(c) is attached to the fins only. At the higher values of suction heads, the lowest pressure is observed at the centre of the DT which leads to the formation of vortex ropes. At Hs/H = 0.420, the area of the lowest pressure zone is larger than the pressure zone at Hs/H = 0.366, hence, the vortex rope strength is comparatively higher (Fig. 5(d) and (e)).
4.4 Draft tube flow velocity and swirl intensity
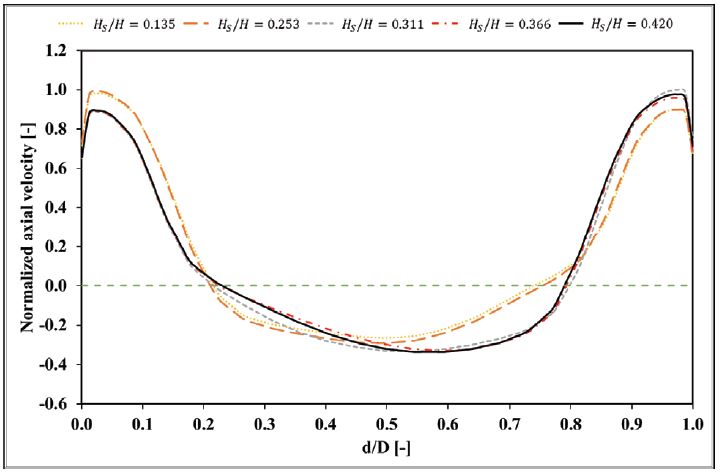
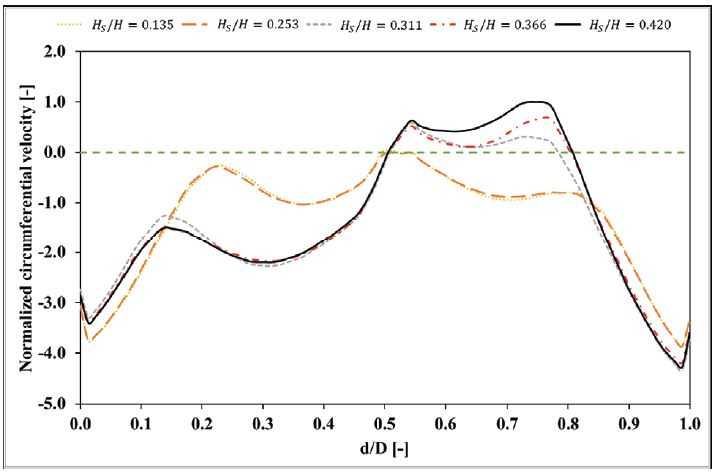
Ideally, the runner exit velocity should be purely axial towards the DT flow but at the PL condition the velocity is more circumferential.(19) The low-pressure zones in the DT are the result of the stagnant region generated due to the circumferential velocity. To investigate the effect of suction heads on the DT inflow velocities, axial and circumferential velocities are calculated at line 1. Line 1 is located at the plane which shows a higher area for the low-pressure zone and for which the vortex strength is also high. Figs. 8 and 9 show the numerical axial and circumferential velocities for different suction heads respectively. The horizontal axis is presenting the diametrical distance. Point 0 shows one end on the DT wall while point 1 is showing the opposite end. Both velocities are normalized using the maximum values obtained during each calculation.
As can be seen from Fig. 8 that for all the suction heads the axial velocities are decreasing significantly because of the operating condition and reaching the vortex zone. The decrement in the velocity is more for higher suction heads. The variation of the velocity for without cavitation cases is negligible and differences in the velocities among cavitation cases also show insignificant variations. However, the increment in the velocity at Hs/H = 0.135 (without cavitation) compared to the velocity at Hs/H = 0.420 ( with cavitation) i s about 20.6%. The vortex zone for without cavitation cases lies between d/D = 0.228 to 0.734 while the vortex zone is bigger for cavitation cases which lie from d/D = 0.241 to 0.785. Thus, the cavitation phenomenon remarkably affects the axial velocities.
The downstream swirl instabilities majorly depend on the circumferential velocities. It can be observed from Fig. 9 that in the negative direction of the runner revolution, maximum values of circumferential velocities are obtained at wall 0 and wall 1 for all the suction heads. The velocity distribution is non-symmetric about the DT centre. The without cavitation cases are showing almost constant circumferential velocities while significant variation can be seen for the cavitation cases. The velocity is minimum at Hs/H = 0.135 and maximum at Hs/H = 0.420. The decrement in the maximum velocity between these two suction heads is about 25.8%. Hence, the circumferential velocities get enhanced when the cavitation is introduced.
To quantify the swirl instabilities, a non-dimensional parameter called swirl number (SW) is calculated in the present study using eq. (4);(20)
| (4) |
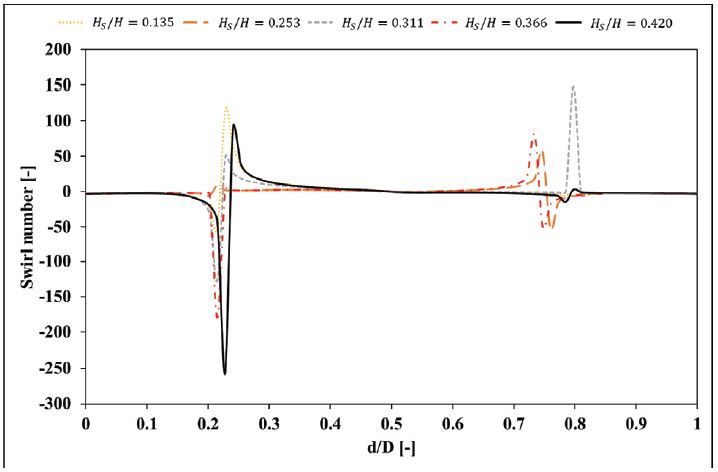
Where the circumferential velocity, axial velocity, radial distance and total radius are denoted by Vθ, VZ, r and R respectively. In line 1 the swirl number for several suction heads is presented in Fig. 10. The horizontal axis of the plot is the same for the axial and circumferential velocity plots. Since the operating condition is at PL condition, all the cases are exhibiting the swirl strength. The swirl instabilities are induced between walls 0.2 to 0.3 and walls 0.7 to 0.8. The maximum swirl intensity is observed at Hs/H = 0.420 while the minimum is observed at Hs/H = 0.253 between walls 0.2 to 0.3. It can also be observed that the higher swirl intensities are obtained for the cavitation cases. The difference between maximum values of swirl intensity for cavitation and without cavitation cases is about 77.8%.
5. Conclusion
The present study investigates the effect of suction heads on the cavitation inception and development at part load condition inside the Francis turbine model. The accurate calculation of the performance and internal flow characteristics of the turbine are performed using the steady-state numerical methodology. The suction head variation is achieved by creating different suction pressure at the DT outlet. It was found that the cavitation severely affects the hydraulic performance as well as the internal flow characteristics. With the increase in suction heads, cavitation is initiated and developed in the turbine. The cavitation is incepted at Hs/H = 0.311, before this value the cavitation is restricted while after this value fully developed cavitating flows occur. The efficiency and power get degraded when the cavitation is induced. The DT head loss is increasing with the suction head increment. The difference between the maximum and minimum head loss is about 2% for with cavitation and without cavitation cases respectively. The vortex rope strength and vapour volume fraction are also increased for the cavitating flows. The lowest pressure zones with the higher area are observed for the maximum value of the suction head. The axial velocity is reduced while the circumferential velocities are increased with the increment in suction heads. About 20.6% reduction in axial velocity and about 25.8% increment in circumferential velocity is obtained for the fully developed cavitation case. The swirl intensity is also increased by about 77.8% for the fully developed cavitation. Finally, at PL condition the safe operating range for the Francis turbine without cavitation is found for which the suction head is 0.135 to 0.311. Furthermore, this study can be utilized for maintaining the stable operation of the Francis turbine with higher efficiency.
Acknowledgments
2022 한국유체기계학회 하계학술대회 발표 논문, 2022년 6월 29일~7월 1일, 휘닉스 평창
This research was funded by the Korea Agency for Infrastructure Technology Advancement under the Ministry of Land, Infrastructure, and Transport (grant number 22IFIP-C128598-06) and partially funded by a grant (No. EM220003) from the Korean Institute of Industrial Technology (KITECH).
References
-
A. Laouari and A. Ghenaiet, “Investigation of steady and unsteady cavitating flows through a small Francis turbine,” Renew. Energy, vol. 172, pp. 841–861, 2021.
[https://doi.org/10.1016/j.renene.2021.03.080]

-
A. Muhirwa, W. Cai, W. Su, Q. Liu, M. Binama, B. Li, and J. Wu, “A review on remedial attempts to counteract the power generation compromise from draft tubes of hydropower plants,” Renew. Energy, vol. 150, pp. 743–764, 2020.
[https://doi.org/10.1016/j.renene.2019.12.141]

- F. Avellan, “Introduction to cavitation in hydraulic machinery,” 6th Int. Conf. Hydraul. Mach. Hydrodyn., no. January 2004, pp. 11–22, 2004, [Online]. Available: http://mmut.mec.upt.ro/mh/Conferinta_MH/102Avellan.pdf.
-
P. P. Gohil and R. P. Saini, “Effect of temperature, suction head and flow velocity on cavitation in a Francis turbine of small hydro power plant,” Energy, vol. 93, pp. 613–624, 2015.
[https://doi.org/10.1016/j.energy.2015.09.042]

- International Electrotechnical Commission. Hydraulic Turbines, Storage Pumps and Pump-Turbines–Model Acceptance Tests; Standard No. IEC 60193; IEC: Geneva, Switzerland, 2019.
-
X. Escaler, E. Egusquiza, M. Farhat, F. Avellan, and M. Coussirat, “Detection of cavitation in hydraulic turbines,” Mech. Syst. Signal Process., vol. 20, no. 4, pp. 983–1007, 2006.
[https://doi.org/10.1016/j.ymssp.2004.08.006]

-
M. S. Iliescu, G. D. Ciocan, and F. Avellan, “Analysis of the cavitating draft tube vortex in a francis turbine using particle image velocimetry measurements in two-phase flow,” J. Fluids Eng. Trans. ASME, vol. 130, no. 2, 2008.
[https://doi.org/10.1115/1.2813052]

-
S. Liu, L. Zhang, M. Nishi, and Y. Wu, “Cavitating turbulent flow simulation in a Francis turbine based on mixture model,” J. Fluids Eng. Trans. ASME, vol. 131, no. 5, 2009.
[https://doi.org/10.1115/1.3112382]

-
I. B. Celik, U. Ghia, P. J. Roache, C. J. Freitas, H. Coleman, and P. E. Raad, “Procedure for estimation and reporting of uncertainty due to discretization in CFD applications,” J. Fluids Eng. Trans. ASME, vol. 130, no. 7, 2008.
[https://doi.org/10.1115/1.2960953]

-
R. Zhang, A. Yu, M. Nishi, and X. Luo, “Numerical Investigation of Pressure Fluctuation and Cavitation inside a Francis Turbine Draft Tube with Air Admission through a Fin,” J. Phys. Conf. Ser., vol. 1909, no. 1, 2021.
[https://doi.org/10.1088/1742-6596/1909/1/012017]

- “ANSYS CFX-Solver Theory Guide,” Release 16.0, ANSYS, Inc., Southpoint, Canonsburg, PA, USA, 2015.
-
N. Sotoudeh, R. Maddahian, and M. J. Cervantes, “Investigation of Rotating Vortex Rope formation during load variation in a Francis turbine draft tube,” Renew. Energy, vol. 151, pp. 238–254, 2020.
[https://doi.org/10.1016/j.renene.2019.11.014]

-
X. Zhou, H. G. Wu, and C. Z. Shi, “Numerical and experimental investigation of the effect of baffles on flow instabilities in a Francis turbine draft tube under partial load conditions,” Adv. Mech. Eng., vol. 11, no. 1, pp. 1–15, 2019.
[https://doi.org/10.1177/1687814018824468]

- P. J. Zwart, A. G. Gerber, and T. Belamri, “A two-phase flow model for predicting cavitation dynamics,” 5th Int. Conf. Multiph. Flow, no. January 2004, p. 152, 2004.
-
F. Bakir, R. Rey, A. Gerber, T. Belamri, and B. Hutchinson, “Numerical and Experimental Investigations of the Cavitating Behavior of an Inducer,” Int. J. Rotating Mach., vol. 10, no. 1, 2004.
[https://doi.org/10.1080/10236210490258034]

-
H. Foroutan and S. Yavuzkurt, “Flow in the simplified draft tube of a Francis turbine operating at partial load-Part II: Control of the vortex rope,” J. Appl. Mech. Trans. ASME, vol. 81, no. 6, 2014.
[https://doi.org/10.1115/1.4026818]

-
S. J. Kim, Y. S. Choi, Y. Cho, J. W. Choi, J. J. Hyun, W. G. Joo, and J. H. Kim, “Effect of fins on the internal flow characteristics in the draft tube of a francis turbine model,” Energies, vol. 13, no. 11, 2020.
[https://doi.org/10.3390/en13112806]

-
M. Nishi, X. M. Wang, K. Yoshida, T. Takahashi, and T. Tsukamoto, “An Experimental Study on Fins, Their Role in Control of the Draft Tube Surging,” in Hydraulic Machinery and Cavitation, 1996.
[https://doi.org/10.1007/978-94-010-9385-9_92]

-
A. Yu, Q. Tang, X. Wang, D. Zhou, and J. Liu, “Investigation of the pressure fluctuation alleviation in a hydraulic turbine by runner modification,” Water (Switzerland), vol. 11, no. 7, 2019.
[https://doi.org/10.3390/w11071332]

-
S. J. Kim, J. W. Suh, H. M. Yang, J. Park, and J. H. Kim, “Internal flow phenomena of a Pump–Turbine model in turbine mode with different Thoma numbers,” Renew. Energy, vol. 184, pp. 510–525, 2022.
[https://doi.org/10.1016/j.renene.2021.11.101]


