Structural Analysis on the Arm and Floater Structure of a Wave Energy Converter
Abstract
Ocean waves have huge amounts of energy, even larger than wind or solar, which can be extracted by some mechanical device. This can be done by creating a system of reacting forces, in which two or more bodies move relative to each other, while at least one body interacts with the waves. This moves the floater up and down. The floaters are connected to an arm structure, which are mounted on a fixed hull structure. Hence, the structure of the floater is very important. A static structural analysis with FSI (Fluid-Structure Interaction) analysis is conducted. To achieve the pressure load for the FSI analysis, the floater is simulated on a wave generator using rigid body motion. The structural analysis is done to examine the stresses on the whole system, and four types of flange and floater are optimized. The result shows that the structure of floater with wood support is the safest.
Keywords:
FSI Analysis, Static structural analysis, Floater, Wave energy converter, Stress키워드:
유체 구조 연성 해석, 정적 구조 해석, 부체, 파력 발전기, 응력1. Introduction
In recent years, with economical development, mankind continues to excessively use and rely on the traditional energy such as coal, oil and natural gas, which causes a global energy crisis. Hence, exploitation and utilization of new and renewable energy is becoming the only way for the human sustainable development in the 21st century.
Oceans cover 70 percent of the earth’s surface and represent an enormous amount of energy in the form of wave, tidal, marine current and thermal resources. Though ocean energy is still in a developmental stage, researchers are seeking ways to capture that energy and convert it to electricity(1). In addition, wave energy includes characteristics that are renewable, no pollution, large reserves and wide distribution but low density, unstable and difficult to use. At present, the technology of wave power generation is entering the stage of commercial development and will develop to a large-scale use and a direction which could be independent and stable.
Wave power is distinct from the diurnal flux of tidal power and the steady gyre of ocean currents. Wave power generation is not currently a widely employed commercial technology, although there have been attempts to use it since at least 1890(2). In 2008, the first experimental wave farm was opened in Portugal, at the Agu adoura Wave Park(3).
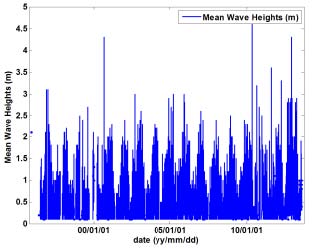
Korean seas in the southern coast have sufficient wave energy for applying a wave energy converter. Fig. 1 shows wave measurement data at Chilbaldo in Jeonnam. A total of 138,624 data was collected from which the mean wave height are shown from year 2000 up to 2010. The wave height ranges from about 1 m to 3 m and have energy density of about 4.56 kW/m.
The major competitor of wave power is offshore wind power. However, companies should not think about wave power as competition but as a bonus with offshore wind technology as both could be used at the same time from the same location. So we suggest that renewable energy such as wind and ocean technologies could be combined and used hand in hand, rather competing between them.
Hence, we try to extract the wave energy by some mechanical device. This can be done by creating a system of reacting forces, in which two or more bodies move relative to each other, while at least one body interacts with the waves. The idea is to generate power by the motion of the waves, letting a floating structure follow the wave motion. This moves the floater up and down. The structure of the floater, arm and cylinder is very important so the structure should be examined for structural feasibility. The purpose of this paper is developing a new kind of floater type wave energy converter and conducting structural analysis for the floater type of wave energy converter and improving the structure of floater.
2. Wave Energy Converter Models and Numerical Methods
2.1 Wave energy converter models
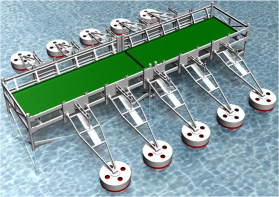
Figure 2 shows the floater type of wave energy converter device. There are ten floaters that are working independently in this whole device, and five on each side.
The main components of the system consist of three main components which are floater, arm and the cylinder. The floater is on the surface of the water, and it follows the wave motion. With the wave motion, the only motion of the floater is up and down. The floater is connected to an arm structure, which are mounted on a hull structure that is fixed. The arm is a connecter between floater and cylinder. The motion and the energy is transferred from floater to cylinder by the arm.
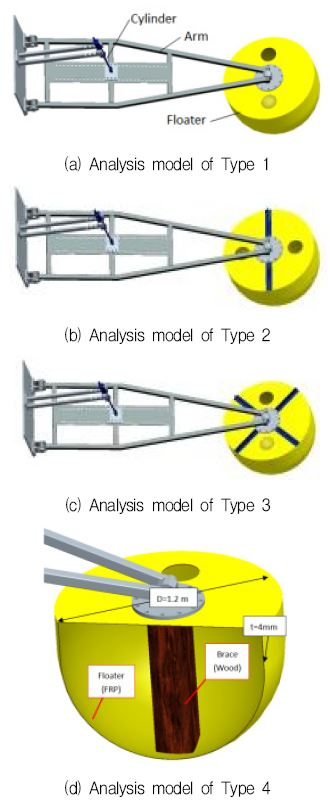
The diameter of floater is D=1200 mm, the thickness of the floater shell is t=4 mm, and the material of the floater is fiber reinforced plastic(FRP) as shown in Fig. 3(d). The length of arm is L=3000 mm and the material of the arm is steel with a hollow structure. The diameter of the cylinder is d=20 mm and the material of the cylinder is also steel.
There are four types of floater system for static structural analysis. Type 1 is the original design, without any support on the floater, and the floater is the same for all four types as shown in Fig. 3(a). The structure of type 2 with single rib support on the cover of floater and of type 3 with cross rib support on the cover of floater is shown in Fig. 3(b) and (c), respectively. The material of the support is steel. However, for type 4, wood is used for support because of its low density, and the wood brace is glued at the centroid of the floater. Fig. 3(d) shows the cross section of the analysis model of type 4 with the wood brace at centroid.
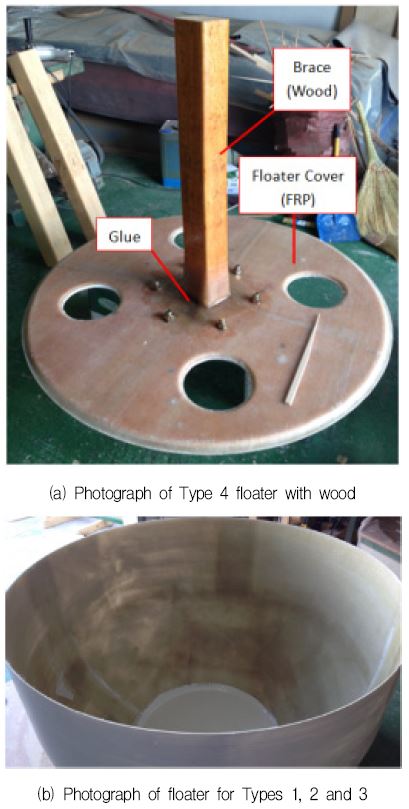
Figure 4 shows the actual photograph of the floaters. Fig. 4(a) shows the internal view of floater of type 4. The wood brace is connected with the cover of floaters by glue, and the material of the floater cover is made by FRP. Fig. 4(b) shows the floater without cover. From type 1 to 4, the structure and material of floater is same.
2.2 Numerical methods
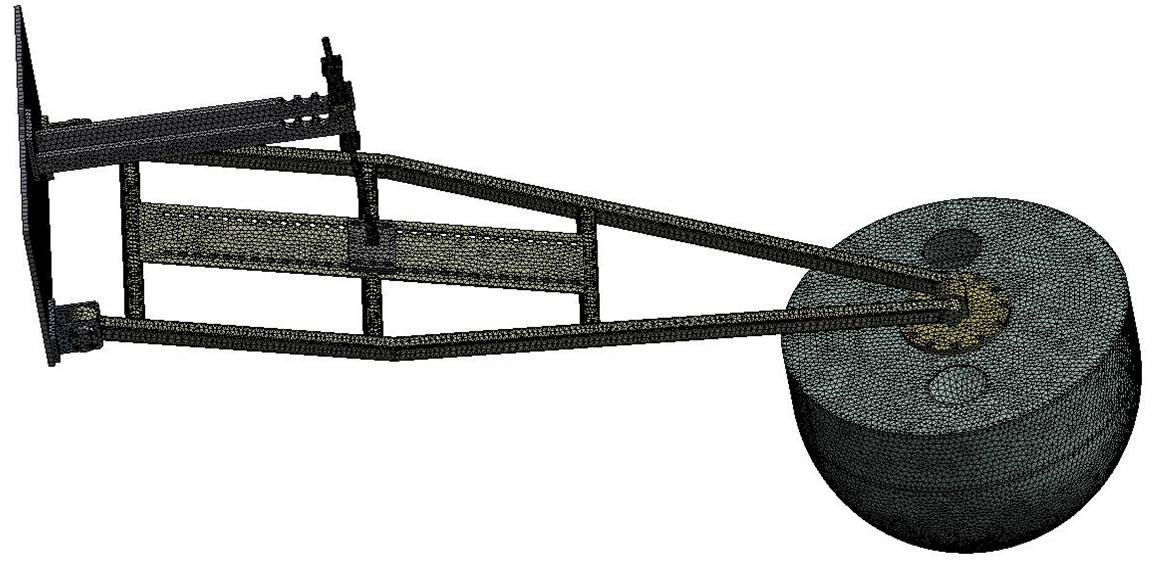
For the numerical analysis on the static structural of the floater, a commercial code of ANSYS CFX(5) is adopted. The grid elements number of about 2×10⁵ and nodes of about 4×10⁵ for the total structure field has been used as shown in Table 1. This table shows the detail for the grid number of each part. Fig. 5 shows the numerical grid of the floater model for static structural analysis. The numerical method is shown in Table 2.
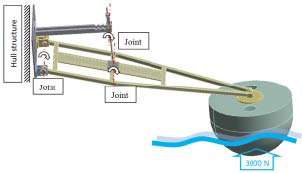
The boundary conditions for the static structural analysis is shown in Fig. 6. The flatbed which is fixed on the hull structure and connected to the arm is set as support of fix boundary condition. There are three joints connecting the arm, hull structure and the cylinder together. The boundary condition of joint is set as revolute. In this study, in order to examine the structure of floater safety under the extreme condition, even though the wave force is a variable, the maximum wave reaction force of 3000 N is used. The force of 3000 N is set at the bottom surface of the floater with upward direction. The inertial condition is set as the standard earth gravity boundary condition. New materials are defined and the density, Young’s modulus and Poisson's ratio are set, as these are mandatory parameters needed for static structural analysis.
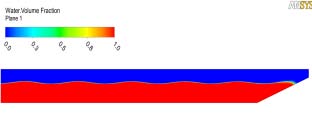
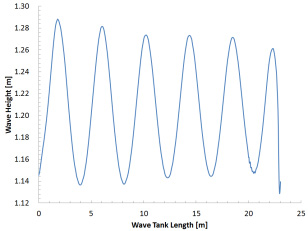
For conducting the FSI analysis, first a 2D wave tank was modelled to simulate appropriate wave characteristics as shown in Fig. 7. The 2D wave tank is only used for checking the CFD method for wave generation. This method reduces unnecessary calculation time for 3D simulation. The wave was generated using the function method as described by Gomes(6). The function method uses the equation describing the motion of the free surface in Stokes second order theory, given by equations 1 to 3, where equations 2 and 3 are velocity components:
| (1) |
| (2) |
| (3) |
where z is the position variation of the free water surface to the seabed and k is the normal unit vector, u is the velocity component in x-direction(horizontal) and w is the velocity component in z-direction (vertical), η is elevation of the wave, ω is the circular frequency of wave. Further details of this theory can be found in McCormick(7) and Dean and Dalrymple [8].
The estimated wave characteristics necessary for the function method settings for 2D simulation are the water depth, h=1.2 m, wave period, T=1.4 s and the wave amplitude, A=0.06 m. The total simulation time was set as 60 seconds. Table 3 shows the boundary conditions for 2D and 3D CFD analysis.
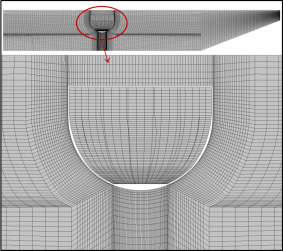
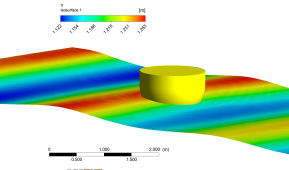
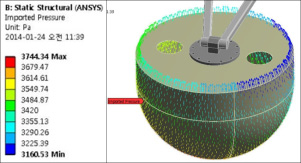
The hexahedral numerical grid is shown in Fig. 8. Using the 2D CFD method, a 3D model was simulated with moving mesh for rigid floater body, shown in Fig. 9. The results obtained from the 3D simulation were imported for the FSI analysis as shown in Fig 10, which is one-way FSI alalysis. The mapping of CFD to static structure analysis was more than 90%. The same numerical grid used for static structural was used for the FSI analysis.
3. Results and Discussion
For the static structural analysis, the stress of the structure is the one of the most important issue. Therefore, there is a need for examining the stress of the floater system. Fig. 11 summarizes a more detailed view of the stresses for each case. Table 4 shows the material properties of the FRP and steel used for the analysis. Material properties for FRP are not very accurately available and for this analysis we have researched a wide range of values and taken values for a moderate strength of FRP usually used by most industries.
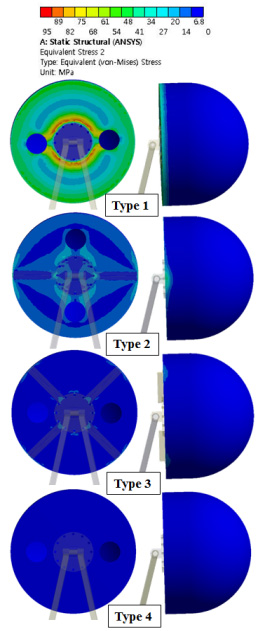
Fig. 12 shows the equivalent stress of the floaters. It is observed that the floater without any support and rib(Type 1) has the highest stress concentrating around the flange and the edge of the floater cover. Type 2 with single rib has the distribution of the high stress moving to both ends of the rib and the value is reduced considerably. For the floater with cross ribs (Type 3), there is little stress around the part where it connects with the flange. Moreover, for the floater with the wood brace support at the centroid(Type 4), the stress reduces less than 10 MPa. The results imply that the floater with cross ribs structure and or with the wood brace support at floater centroid reduced the stress effectively, especially for Type 4, the stress almost less than 10 MPa. It is also observed that the arm sustains the maximum stress out of all the parts analyzed for all the cases.
The 2D wave simulation results as seen in Fig. 13 shows the average wave height for a time of 10 to 60 seconds. After 10 seconds the waves become steady and there is a very little change seen. The wave height fluctuates from 0.11 to 0.14 meters. A similar trend was observed for the 3D simulation so the result at 10 seconds was imported for fluid structural interface analysis.
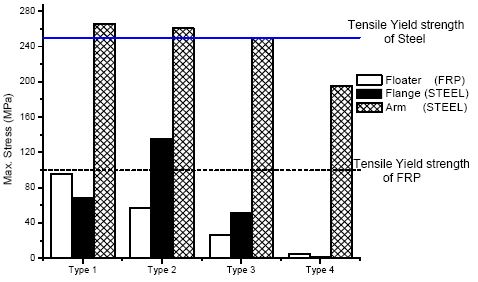
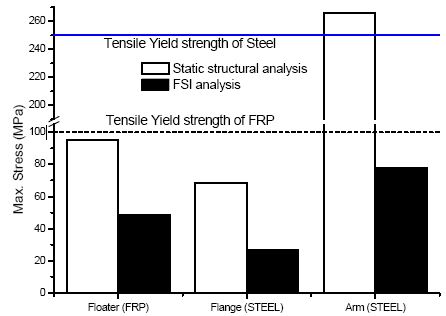
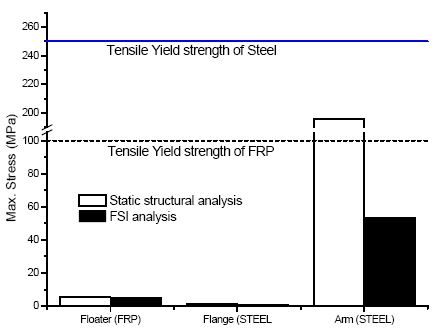
Results show as seen in Figs. 14 and 15, comparison between static structural and FSI analysis. It indicates that the floater and arm structure are safely below the tensile stress of the materials. However, for FSI analysis of Type 1, it is observed that the stress is high for every component and it will not be recommended for the implementation. The best case is observed at Type 4, as it shows the small stress on the floater, flange and arm.
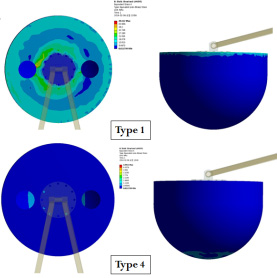
Figure 16 shows the equivalent stress of the floaters by the FSI analysis. There is relatively high stress region concentrating around flange and the edge of the floater cover of Type 1. The stress on the floater was suppressed effectively by wood support(Type 4). This shows similar trend with the that of static structural analysis.
Generally, the stress of static structural analysis is higher than that of FSI analysis, which means that the assumed force for static structural analysis is quite large in contrast to the wave simulation force. This means that if design is only made by static structural analysis then the structure can be more safely constructed considering a higher safety factor. In order to avoid over design of the structure, FSI analysis shows a more improved design considering the manufacturing cost of materials used.
4. Conclusion
The study concludes that an improved safe design for the floater, arm and flange is achieved by the static structural and FSI analysis by comparing 4 different types of cases. Case 4 presents the safest design in contrast to other cases and this design has been suggested for implementation. The stresses on the arm, and flange are quite low in contrast to the stresses on the arm. The arm sustains the maximum stress. The FSI analysis shows lower stress because the maximum force from the simulation was lower than the 300 kilograms(maximum assumed force) applied for static structural analysis. This means that wave simulations provide us with more logical results in contrast to assumptions.
Acknowledgments
This work was supported by the New and Renewable Energy of the Korea Institute of Energy Technology Evaluation and Planning(KETEP) grant funded by the Korea government Ministry of Trade, Industry and Energy(No. 2013T100200066)
References
- Burman, K., and Walker, A., “Ocean Energy Technology Overivew”, MS 301 1617 Cole Boulevard Golden, CO80401, (2009).
- Miller, C., "Wave and Tidal Energy Experiments in San Francisco and Santa Cruz", (August 2004).
- Babcock, J. L., “EDP and Efacec to Collaborate on Wave Energy Projects”, Bloomberg, September 23, 2008.
- Korea Meteorological Administration, www.kma.go.kr.
- ANSYS Inc., “ANSYS CFX Documentation 2013”, www.ansys.com.
- Gomes, M. N., Olinto, C. R., Rocha, L. A. O., Souza, J. A., and Isoldi, L. A., “Computational Modelling of a Regular Wave Tank”, Thermal Engineering, (2009), 8, p44-50.
- McCormick, M. E., Ocean engineering wave mechanics, John Wiley & Sons, USA, New York, (1976).
- Dean, R. G., and Dalrymple, R. A., Water wave mechanics for engineers and scientists, vol. 2, World scientific, Singapore, (1991).
- Micelli, F., and Nanni, A., “Mechanical Properties and Durability of FRP Rods”, Center for Infrastructure Engineering Studies, (2001), Report.
- Schmit, K., “Fiberglass Reinforced Plastic (FRP) Piping Systems Designing Process/Facilities Piping Systems with FRP a Comparison to Traditional Metallic Materials”, Specialty Plastics Inc., (1998).
- Reichhold, “FRP Material Selection Guide”, An Engineer’s Guide to FRP Technology, Reichhold Inc., (2009).
