Three-Dimensional Primary Design of a 3kW Class Electronically Commutated Motor Fan Impeller
Abstract
Fans are one of the biggest energy consumers in any industrial plant. Nowadays, fans are critical to the efficient performance of air handling systems. In Korea, the government is taking measures to build efficient fan technology. Electronically Commutated (EC) fans are an ideal choice because they provide advantages such as reduced energy consumption, variable speed operation, low operating noise, and increased reliability. In the present study, an EC mixed-flow fan is designed and its performance is evaluated using steady-state numerical analysis. Fan performance curves are obtained when the fan is analyzed using different flow rates and rotating speeds. The numerical studies aimed to analyze fan performance based on operating conditions like rotating speed, flow rate, impeller tip diameter, and total pressure as provided by the fan manufacturer. Steady-state Reynolds Averaged Navier-Stokes equations (RANS) were solved on the generated mesh with a Shear Stress transport (SST) turbulence model implemented on the three-dimensional (3D) mesh. The numerical results are validated by comparing them with specification data provided by the fan manufacturer. The input power of 2.97 kW obtained through computational analysis is identical to the power rating required by the fan manufacturer. This indicates the reliability of the impeller design presented in this research. The blade loading plot shows that both the suction and pressure sides of the impeller blade show a smooth gradient without abrupt changes, indicating a good aerodynamic design of the blade. The pressure distribution plots signify that there is a significant rise in pressure when the flow passes through the impeller blades. In these plots, the pressure changes are not abrupt with a few exceptions on suction side of blade, which suggests flow separation occurred on suction side of blade. The velocity vector plot depicted efficient energy conversion by impeller blades. It also highlighted energy losses due to formation of a stagnation zone.
Keywords:
EC Fan, Mixed-flow fan, Cordier diagram, Aerodynamic design, Performance curves, Numerical analysis, Impeller design1. Introduction
An EC fan is a highly efficient fan that uses an EC motor, allowing for precise speed control and optimal performance. EC motors are brushless Direct Current (DC) motors with built-in electronics that enable variable speed operation, making them ideal for applications requiring adjustable airflow [1]. The EC fans are becoming progressively vital due to their superior energy efficiency and outstanding performance characteristics. These fans can often achieve an efficiency of up to 92%, meaningfully reducing energy consumption compared to conventional fans [2]. Traditional fan technologies often suffer from inefficiencies, particularly at variable speeds, leading to significant energy wastage [3]. The demand for EC fan technology arises from the growing emphasis on energy conservation. The South Korean fan industry is experiencing remarkable growth and it is now looking to adopt this efficient EC fan technology [4].
The key elements this study emphasize are its focus on describing in detail the primary design procedure and the use of non-dimensional coefficients. Unlike other research cases, that emphasized the EC motor's power consumption and cost-effectiveness of ECM-powered fan systems, this work uniquely prioritizes impeller design methodology and further examines the detailed flow characteristics under varying operating conditions.
The main feature of the innovative design proposed in this work is the use of empirical relations based on non-dimensional coefficients that are used to evaluate impeller performance metrics. An initial impeller design is proposed using these coefficients. Non-dimensional coefficients allow for easy scaling of fan designs while maintaining similar performance, thus reducing trial and error. The design process becomes more systematic as designers can quickly assess how changes in geometry or flow conditions affect efficiency, thus reducing reliance on experiments or CFD simulations. Using the Cordier diagram, which relates these coefficients, helped us to identify the appropriate fan type that should operate at its best efficiency point [9].
The performance is evaluated by varying the impeller's rotational speeds, which mirrors the actual operation of ECM fans. In ECM fans, the speed is modulated based on the flow demand. This approach aligns with real-world operational scenarios, offering practical relevance to the findings of this study.
The EC motor offers a unique external rotor design, unlike the commonly used internal rotor design in AC motors. The rotor rotates outside the stator. The impeller is mounted directly to the rotor [2]. Therefore, ECM fans, unlike conventional fans, do not require a shaft for transmitting power from the motor to the impeller, so transmission losses are non-existent. This factor is a major contributor to the much higher efficiency of ECM blowers compared to others.
Due to their compact design, ECM blowers are suitable for applications requiring less installation space [3]. Moreover, multiple ECM parallel fans can be installed in a horizontal direction specifically in a single air handling unit (AHU). This feature ensures minimum turbulence and efficient movement of air, which is not possible with conventional fans. U nlike conventional blowers, ECM blowers have fewer moving parts, leading to reduced mechanical wear, less frequent maintenance, and a longer lifespan. The compact unit also allows dynamic balancing of the entire rotating assembly, which helps to reduce fan noise & vibrations [5].
In conventional fans, mostly the efficiency drops when a fan operates away from its design point. But in ECM blowers, variable speed control allows accurate matching of airflow to system demand. For this purpose, blade geometry is made complex, and ECM impellers perform more efficiently in a broad range of operating points [5].
2. Literature Review
In the past few years, many researchers highlighted the benefits of EC motors for enhancing the energy efficiency and cost-effectiv eness of industrial fans. L.Newborough et al [6] evaluated the low efficiency of traditional AC motors and emphasized the benefits of EC brushless DC motors for driving tube-axial fans as a far superior alternative which helped the fan unit in achieving two times more efficiency along with an 80% reduction in energy consumption and 52% saving in weight. Kerstin et al [7] compared the power consumption of EC motors to traditional permanent split capacitor (PSC) motors in air terminal units. It was found that EC motors consumed less power than PSC motors across all operating points. The cost difference for operating the EC motor ranged from about 30% lower during high flow rate conditions to about 70% lower during reduced system demand. Ho-Chiao Chuang et al [8] proposed an energy-saving method using variable air volume for fan-coil units (FCUs). A brushless EC motor was employed to regulate air volume for precise speed adjustment. The results indicated that using an EC motor caused FCU energy consumption to drop from 4.558 kWh to 2.888 kWh.
At this time, the primary focus of all research as evident from the above literature is energy saving using EC motor. Past research has been silent on the aspects of fan aerodynamic efficiency. Through this paper, a novel impeller design and its CFD validation are presented and the aerodynamics of impeller blades are discussed, which will prov ide support to cover the research gap.
3. Design Methodology
3.1 Fan selection
A specific speed is used to categorize the type of fan to be used for a certain application. With design specifications, specific speed is calculated using eq. (1) [9], which has a value of 1.75. Generally, when a specific speed (Ns) is in the range of 1.0 < Ns < 1.8, the type of fan will be a mixed-flow fan [9]. Additionally, using specific diameter (Ds= 2.2) as a basis in eq. (2) [9] and the correlation between Ds- Ns in eq. (3) [9], derived from the Cordier diagram for high-efficiency turbo machines, ensured that this fan will not only operate at this best efficiency point (BEP) but will also meet performance requirements of flow rate (Q), and total pressure difference (ΔPt). The impeller is designed in CFturbo software (Version 2022 R2.2).
| (1) |
| (2) |
| (3) |
N is rotation speed (rad/s), Q is flow rate (m3/sec), ΔPt is the total pressure difference (Pa), ρ is the density of air (kg/m3), and D is the impeller diameter (m).
In Table 1, the known specifications are outlined which helped us to assess and plan the impeller design process. These specifications provided a baseline for designing an aerodynamically efficient impeller. The design specifications serve as critical physical and operational constraints that define the operating requirements and performance targets of the intended fan. By starting with these predefined specifications, the design process focuses on achieving an impeller that operates efficiently at the target conditions. These parameters are essential because they directly influence the aerodynamic and mechanical design of the impeller. The specification values form the foundation for achieving design objectives such as aerodynamic efficiency & energy consumption.
Using these design specifications, optimum values of head, flow and, power coefficients (ψ, φ, ᶓ) are calculated. Head coefficient is ratio of pressure produced by fan (ΔPt) to dynamic pressure of blade's peripheral velocity (ρ/2)*u2 [11]. It helps in evaluating the efficiency of the fan to convert mechanical energy into kinetic energy. Formula for head coefficient is given [9].
| (4) |
Using this formula pressure coefficient is determined. Then by rearranging, peripheral velocity at impeller outlet (u2) is calculated.
Flow coefficient is a dimensionless parameter used to characterize the performance of fans [9]. The flow coefficient normalizes the flow rate based on parameters like fan speed and size. Q is in m3/sec.
| (5) |
Then eq. (5) is rearranged to find out impeller tip diameter. D= 0. 355m is a value obtained from eq. (5). This indicates, at this diameter, the impeller efficiently meets the demand of required flow rate.
Power coefficient is also another important factor in fan design. It relates the actual power required by fan to the theoretical power available in the fluid. It is derived from empirical data. The power coefficient normalizes the fan power with respect to flow conditions and geometry. It is given below [9].
| (6) |
In eq. (6), ᶓis the symbol of power coefficient, P is input power in Watts, ρ is the density of air, N is rotation speed in rad/s. D is the impeller diameter (m).
Fan efficiency is ratio of product of head and flow coefficients divided by the power coefficient [9]. To maximize efficiency best combination of these coefficients is obtained.
| (7) |
In this fan, the impeller design is backward-curved blades (BC). According to the Euler equation (eq. 8), the pressure head is developed by blades [11].
| (8) |
| (9) |
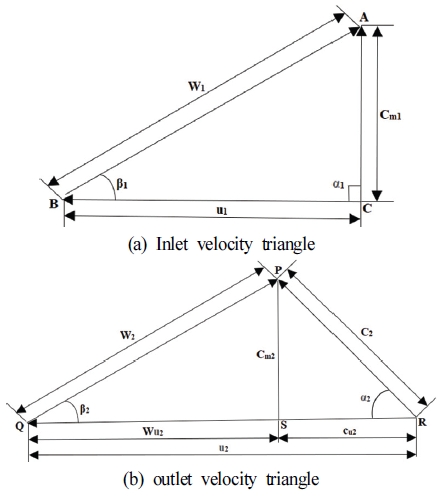
Eq. (9) shows that as β2 is increased, the absolute velocity at exit c2 is also increased. A bigger c2 value resulted in a higher cu2 value, which caused an increase in pressure head. The value of cu2 can be calculated from velocity triangle using above formula [13]. The vector sum of peripheral velocity (u) and relative velocity (W) is absolute velocity (C), these vectors construct two triangles. Using these triangles shown in Fig. 1, entry and exit angles β1, and β2 are determined respectively.
The values of velocity components are taken from CFturbo software. However, these values can also be computed using theoretical formulas as well.
From velocity triangles two equations (eq. 10, 12) are formed which compute entry and exit angles β1, β2.
| (10) |
| (11) |
| (12) |
| (13) |
In eq. (10) Cm1 is meridional component of absolute velocity in (m/s) and Wu1 is circumferential component of relative velocity in (m/s) at leading edge of blade. The value of β1 from eq. (10) is 47.7°. In eq. (11) Cm2 is meridional component of absolute velocity in (m/s) and mu2 is circumferential component of relative velocity in (m/s) at trailing edge. Cu2 is a circumferential component of absolute velocity. *β2 is angle of reduced flow. The value of *β2 from eq. (12) is 32°. To calculate β2, consideration of slip factor is necessary because the direction of relative flow W2 at impeller outlet does not exactly follow the blade surface and, flow gets deflected and reduced. This is called slip velocity. The slip is estimated using an empirical model. The angle of flow deflection should be 10°∼14° to restrict the high turbulence losses. In this impeller, the deviation angle is 13.7°so exit β2 is 45.7° which is sum of angle *β2 and deviation angle.
The efficiency of centrifugal fan depends on higher pressure rise (ρgH) that is achieved by optimized blade shape. The efficiency is given [9].
| (14) |
In a backward curv ed shape, the blades are swept radially resembling a circular arc [10]. The radius of curvature R of circular arc blade is computed using the formula given below [11]. Here r1 and r2 are radii of circles formed at leading and trailing edges.
| (15) |
The number of blades for this mixed-flow impeller is 9 blades. Many fan handbooks recommend between 8 to 12 blades is a good selection [10]. The number of blades is computed using this empirical formula given by Pfleirderer [14].
| (16) |
In eq (16) d2 is impeller diameter, d1 is inlet diameter at entry. 6.5 is an empirical constant (Kz). An increase in the number of blades resulted in a narrow passage between the blades which provided better guidance to the air stream. However, it caused resistance to flow due to blade blockage, but this resistance is not too high. To mitigate flow resistance blade thickness is kept lowest to ensure smooth airflow. Thinner blades aided in reducing friction losses and flow turbulence. Careful attention is given to the exit angle β2. The angle β2 is very crucial for proper guidance of air through flow channel [13]. Typically, the β2 angle value for BC blades is between 35° to 50° [10]. In this fan, the β2 angle is kept at 45°to ensure air direction is diagonal. Increasing the number of blades and high β2 caused a high boost in fan pressure. Blade span is another important feature in this impeller design. In this impeller, the blade span is longer (9 spans) so it helped to increase the surface area available for interaction with the flow of air.
3.2 Preliminary design procedure
To design an impeller three parameters are required to be defined. These are flow rate, total pressure difference and rotational speed, their values are put in the global setup in CFturbo [15]. Also, the rotation direction of the impeller is set.
The next step is to define the Impeller material which is stainless steel (density 7,750 kg/ m3).
Then Impeller main dimensions are defined. These dimensions depend on approximation functions that are based on experimental data. Euler equation of turbo-machinery is the basis to compute these dimensions and these are automatically calculated by software. The dimensions are given in Table 3.
In the next step, the meridional contour is sketched. The shape of shroud is kept tapered. The hub and shroud are represented by 4th-order Bezier curves. The outlet is designed to be diagonal. The second stage is specifying material to the hub and shroud. When the impeller design is completed these material parts and blade solid are connected to make a single solid impeller. The third stage is defining the secondary flow path e.g., diffuser. Since for this design, no diffuser is required, that's why no secondary flow path is defined [16].
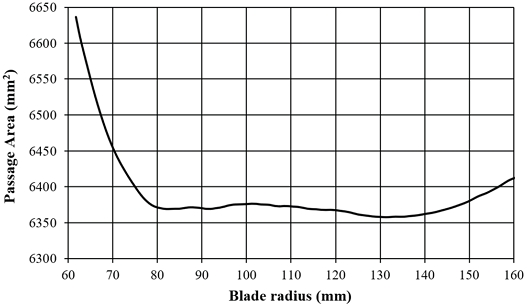
In the final stage, the shape of leading and trailing edges is defined. The leading edge is rounded and elliptical while the trailing edge is abrupt and straight. This is because, at the trailing edge, the requirement is to reduce blade blockage in flow passage to ensure smooth airflow. In Fig. 2 it can be seen that the blade passage is reducing along the blade radius. This is as per need, to guide the air stream in the required direction.
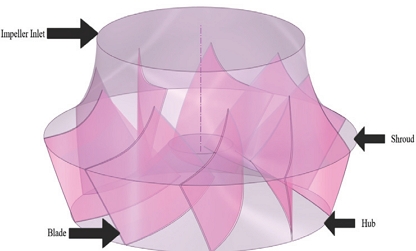
Finally, a 3D impeller geometry is obtained (Fig. 3).
4. Numerical Analysis
4.1 CFD setup
The traditional method of experimental study of fans is often complex, time-consuming, and expensive, making it less appealing. The advancement of numerical investigation, especially the use of computational fluid dynamics (CFD), has emerged as an effective technique to analyze the internal flow characteristics of fans. CFX 2021 R1 is used for the numerical analysis [17]. The fan analyzed in this study is an ECM plenum fan, which basically does not include a casing or housing as part of its design. Plenum fans are specifically designed to operate without any of these additional flow path components, relying instead on the surrounding plenum for airflow distribution. Therefore, the computational analysis was restricted to the impeller domain only. Moreover, the analysis presented in this work was based solely on CFD simulations, which were performed with great care to ensure accuracy through proper mesh refinement, selection of appropriate boundary condition and turbulence modeling. In future studies, this work will be extended to include experimental test results to validate the numerical results.
The 3D model from CFturbo is imported into the ANSYS design modeler. In the design modeler, by combining hub, shroud, inlet, and outlet curves on the ZX plane, the flow path is generated. Then the flow path was used to generate export points for fan geometry. The export points generated three curves namely hub, shroud, and blade. Then these curves are used in BladeGen.
4.2 Mesh generation
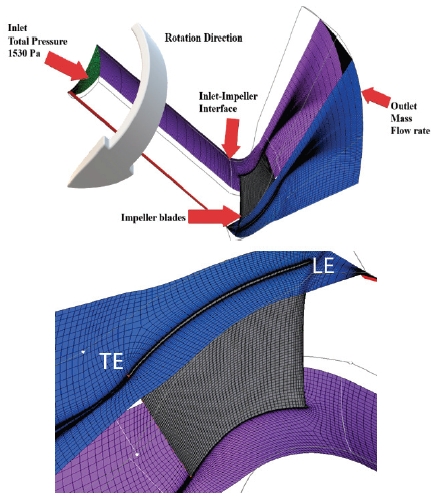
The precision of the computational solution depends heavily upon the mesh quality. The numerical solution of the flow field's partial differential equations requires computations at definite discrete points. The grid generation process involves the placement of these discrete points throughout the entire flow field. For the model fan, complete flow passages are taken into account during mesh generation. A Hexahedral-type mesh was generated on the 3D model of the fan using TurboGrid meshing software. The generated mesh of the mixed flow fan model is shown in Fig. 5. The y+ method was used to obtain a fine mesh for near-wall regions of the flow domain. For the entire flow domain, the distance from the wall to the first node is considered for the y+<2, based on the turbulence model of the current study. Unlike axial fans, the centrifugal fans often require computational domain extension. In the present research, the numerical analysis is performed on extended domains.
To achieve an optimal mesh, it is essential to assess mesh dependencies. The grid convergence index method (GCI) developed by Celik et al. [18] is used to verify mesh dependency. In the GCI method, three separate meshes are used to check the uncertainty caused by discretization errors. The extrapolations are performed with mesh refinement factor of 1.307 and 1.272. The efficiency and head are selected as the main variables and their values are normalized against those found from the fine mesh. As the number of elements increases, the values in Table 5 exhibit a pattern of monotonic convergence.
Celik et al. [18] recommended, that the main variables must have index values of less than 1% ensuring smaller error. Hence, the smaller values of the GCIFine and e21 show that the mesh is optimum and more refinement is not needed. Hence, the ideal mesh have 0.46M elements.
4.3 Boundary conditions
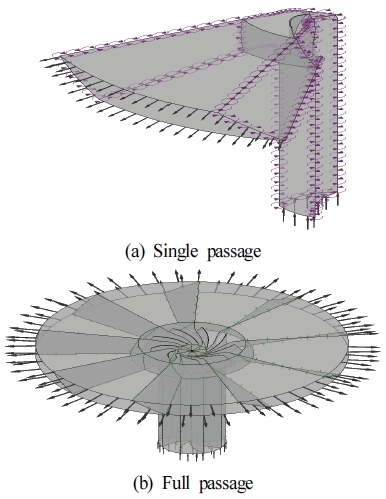
The steady-state analysis was carried out on both single-passage and full passage. The fluid domain is created by joining the fan components with interfaces. General Grid Interface (GGI) is used to transfer data at the linkage of domains. The rotating and stationary parts are coupled using the stage mixing plane interface for steady-state simulation. The stage mixing model transports the data by circumferential averaging at the boundary between the spinning and stationary domains [19]. Commonly known boundary conditions are employed for the CFD. The inlet is specified by the total pressure and the outlet is specified by mass flow rate. The no-slip boundary condition and automatic wall function are used on the walls of all domains. The working fluid air is set at 25°C. The impeller is set to be a rotating domain having an angular velocity of 3214 revolutions per minute and a reference pressure of 1 atm. The hub and shroud are also set to be rotating walls of the impeller. The inlet & outlet are set to be stationary domains. At the inlet, a turbulence intensity level of 5% is applied. The model was solved numerically for these operating conditions applied to inlet and outlet domains [19]. RANS equations were solved on the generated mesh with an SST turbulence model implemented on the mesh. The SST blended the k-ε and k-ω models to provide accurate flow predictions in near-wall and the flow stream.
4.4 Numerical procedure
A high-resolution central approach is employed to discretize the convection and diffusion terms. The turbulence numerics are of the first order. The flow regime is set to be subsonic type. Maximum 2000 iterations were set to reach convergence in solution. The root-mean-square (RMS) value of the residuals is used for the time-varying convergence standard, and the value is set at 10-6. In the present work, the auto time scale is used with the timescale factor set to 5. Various expressions for calculating fan efficiency, input power, total pressure at the outlet, etc. are put in the output control and also set as monitor objects to evaluate fan performance based on their values [19].
5. Results & Discussions
The fan model having 9 blades is simulated and the results obtained from CFX-post are discussed hereafter. It is worth mentioning that all flow field analysis performed in this research is done on a design point of 80 m3/min to ensure that CFD reflects the actual working conditions of the fan. The logic to this approach is to have a consistent comparison between different rotational speeds. The purpose is to evaluate how the impeller behaves aerodynamically at different speeds, helping to identify potential areas for design improvement. 80 CMM is rated design flow rate. By anchoring the analysis to this condition, it is evaluated whether the impeller meets its performance targets under the most significant design point. ECM fans frequently operate near their rated design point for extended periods. Therefore, understanding the flow field at this condition provides valuable insights into the fan's aerodynamic efficiency and internal flow patterns. Initially, it is tried to assess whether the impeller design satisfies the rated operating point first, before considering off-design behavior. This approach is appropriate for assessing the aerodynamic characteristics at a rated operating condition. The insights gained at a fixed flow rate provide a starting point for further investigation into variable flow rate scenarios, offering base data for improving the impeller design.
5.1 Comparison of single passage & full passage
The single blade passage analysis method allowed to reduce computational cost and provide faster simulation time. The full passage analysis method provided a comprehensive view of the fan's performance by capturing the correct operating conditions with high accuracy. Overall, in this research, the single passage method is the preferred approach because of the efficient use of computational resources for early-stage design. Moreover, the CFD result obtained from full-passage method is not much different from single-passage so we concluded that single-passage method is enough at this stage. This study evaluated the fan performance based on specification data given by the fan manufacturer. The resulting values gained from CFD analysis are in good agreement with fan specification data. In Fig. 5 single blade and full blade passages are displayed. In Table 6, a comparison of single-blade passage and full-blade passage is shown [19].
5.2 Fan performance curves
The fan performance is analyzed on different flow rates and rotating speeds to assess the effect of speed variation on pressure rise and efficiency. Analyzing the behavior across a range of speeds helps identify optimal operating points and any potential aerodynamic inefficiencies. Changes in impeller rotating speed affect internal flow physics which helps to understand flow separation patterns, pressure contours, velocity streamlines, etc. Additionally, fan curves are generated at different rotational speeds which allow designers to determine the fan's capability across a wide range of operating conditions. This ensures that the impeller design not only meets the rated design point but also performs efficiently in off-design conditions. The fan model is simulated by changing the rotating speed of impeller and flow rate to observe how variation in speed and flow rate affect its performance.
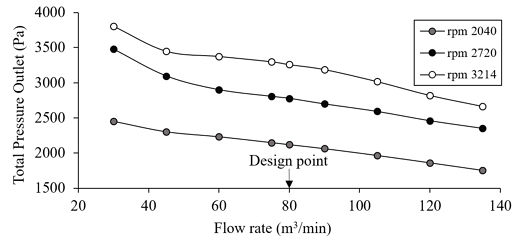
Fig. 6, shows that compared to other rotating speeds, the highest value of fan outlet pressure is obtained at design point of 80 m3/min The curve showed a steeper drop in total pressure beyond 105 m3/min. This suggested increased aerodynamic losses which limited the pressure recovery as the flow rate increased. This decline in total pressure at high flow rates pointed towards a reduction in efficiency at these higher operating points.
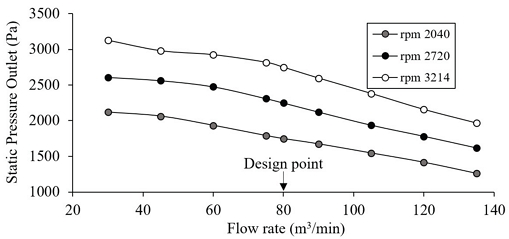
Fig. 7 indicates that at lower RPMs, the optimal flow rate is between 45∼80 m3//min. At 3214 rpm, the pressure dropped significantly after 105 m3/min, which suggests the fan reached a flow rate beyond its design point where pressure generation becomes less efficient. This means operating this fan outside the optimal range will lead to higher energy consumption. The pressure drop could be mitigated by optimizing the blade angle.
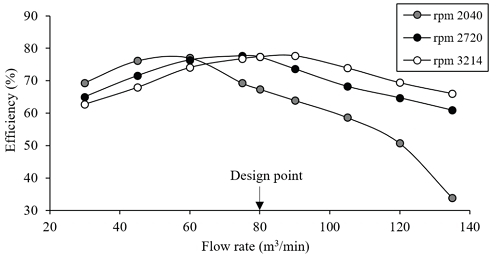
It is shown in Fig. 8 that at 3214 rpm and 80 m3/min best efficiency point is obtained. At 3214 rpm, the efficiency slope is less steep, indicating a wider range of flow rates where the fan operates efficiently. Normally, when speed is increased the BEP moves to higher flow rate and higher-pressure conditions. The BEP shifting is validated by the affinity laws as given in eq. (17). Flow rate is directly proportional to speed so BEP shifts.
| (17) |
The observed shift in BEP and changes in efficiency slopes are normal behaviors in fan performance. At high flow rates, beyond the BEP, the fan's efficiency declined. This is because the flow conditions become less optimal for energy transfer between the impeller and the fluid. The reasons for this trend are adverse pressure gradients at the blade surface and flow instabilities due to transient effects that are not fully captured in all of these CFD analyses as only the steady-state simulations are performed on different flow rates.
Another possible cause in efficiency fluctuations is flow separation at certain flow rates. As the flow separated from the blade, it caused sudden decrease in pressure recovery and increased the drag forces which led to efficiency losses. Moreover, at high flow rates shock losses at the impeller inlet and outlet become more dominant. Running at low operating speed condition add to this efficiency decline.
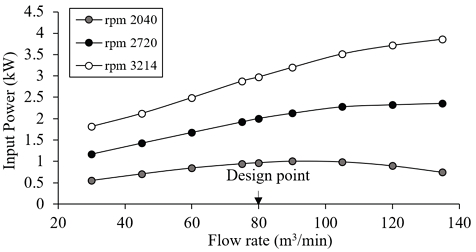
In Fig. 9, input power is plotted against different flow rates. For this fan, the required flow rate is 80 m3/min. The authenticity of the numerical analysis performed in this study is validated through this performance curve because at 80 m3/min the power as plotted on the curve is matching with required input power given in Table 1.
5.3 Impeller blade loading at different spans
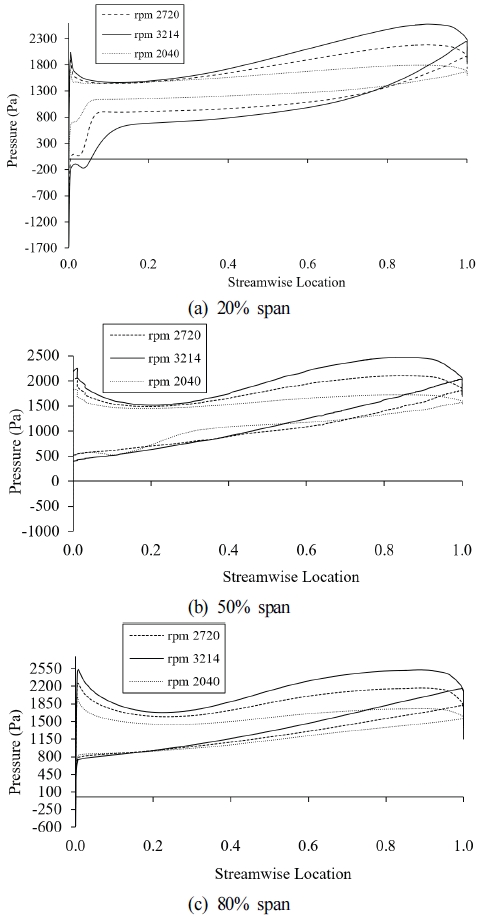
Blade loading refers to the distribution of pressure along the blade surface. In Fig. 10 blade loading plots at different spans and rotating speeds are shown. In these plots, the Y-axis shows the pressure difference. The X-axis denotes the stream-wise position from the leading edge (0) to the trailing edge (1). The upper line represents the pressure side. The lower line characterizes the suction side of blade. On the suction side, a drop in pressure at the leading edge (between 0.0 ∼ 0.1) is common at all spans but the largest low-pressure zone is formed at 20% span. The reason is stronger blade curvature near hub which causes the air to accelerate rapidly at LE, resulting in higher suction effects (i.e. lower pressure). This low-pressure region is marked by the highest negative pressure value (-1700 Pa) in blade loading plot in Fig. 10 (a). The high negative pressure at the LE near hub indicates flow separation in this region. The 50% span in Fig. 10 (b) is intermediate in blade loading between 20% and 80% spans. On 50% span at 2040 rpm, between 0.2∼0.4 increase in pressure is much greater compared to 2720 rpm. The reason is less severe pressure gradient at low rpm which led to more attached flow over certain portions of blade. The better flow attachment resulted in unexpectedly higher local pressure between 0.2∼0.4. Fig.10 (c), shows that at 80% span, here the centrifugal forces are highest of all spans which resulted in more acceleration and streamlined flow. However, at 80% span on 3214 rpm, a large drop in pressure at trailing edge is observed. This is due to higher relative velocity of air at higher RPM at TE and energy losses due to turbulence, contributing to a sharp drop in static pressure at TE.
It is clear from these blade loading charts that blade shape requires changes. This shows the optimization of leading and trailing edges of blade is necessary to mitigate adverse pressure effects.
5.4 Comparison of relative velocities on blade's trailing edge surface at different rotation speeds
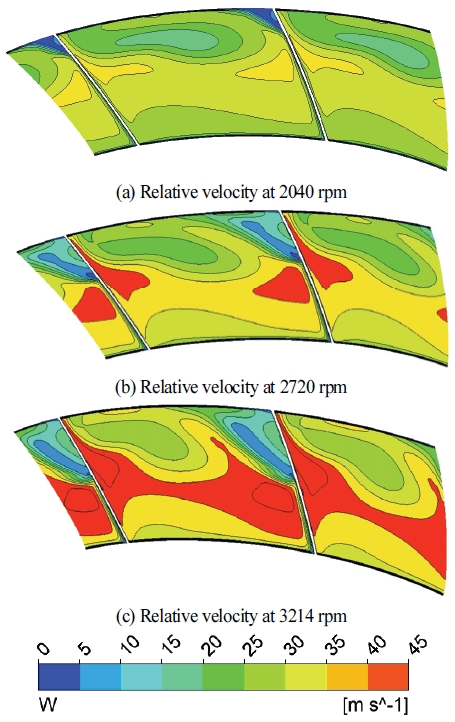
The relative velocity is the velocity of air relative to moving blade. Fig. 11(a) showed relative velocity at 2040 rpm. The increase in relative velocity is not uniform across the blade surface. The maximum relative velocity is 35 m/s, noticed at mid-section, showing the flow is more attached to blade at this section. The low-velocity region near tip of TE is due to no-slip condition imposed on impeller surface at the wall. This condition led to zero relative velocity at the wall, meaning the air adheres to the wall surface and does not slip over it. The fluid velocity changed from zero to free-stream velocity while moving away from the wall, so owing to these viscous effects the velocity near to tip of TE is much lower than the velocity of bulk flow. In Fig. 11 (b) relative velocity at 2720 rpm is pres ented. As higher rpm caus ed an increase in kinetic energy of air, so here an obvious increase in relative velocity is observed. Fig. 11(c) presented relative velocity at 3214 rpm. The maximum relative velocity of 45 m/s is dominant at mid-section which indicated better flow attachment in this area and higher rpm resulted in efficient energy conversion.
5.5 Comparison of pressure distributions on blade surfaces for different rotational speeds
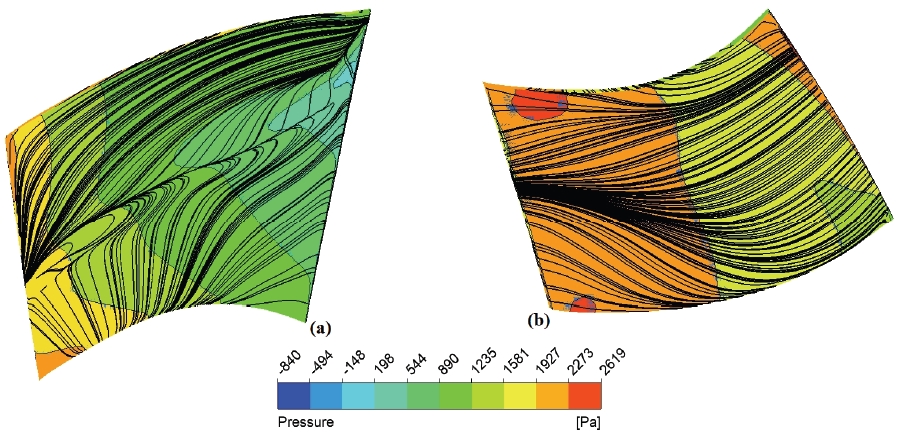
Fig. 12 (a) shows the pressure contour on the suction surface of the blade at 2040 rpm. The black lines are velocity streamlines. The colored contours represent pressure distribution on blade. At the leading edge, due to high flow velocity, the pressure dropped (marked by sea green). Moving along the suction side, at the mid-span, a region of higher pressure (green to yellow) is observed as flow stabilized here. At the trailing edge, the pressure rises to 1986 Pa, represented by red color. Fig. 12 (b) presented pressure contour on pressure side of blade. At the LE, the pressure is high due to attached flow. On the mid-span, the pressure reduced slightly, then increased afterward. As the flow approaches the trailing edge, the pressure increases, as shown by the orange color with a few red regions. The streamlines are relatively smooth. The streamline density near the TE is high, indicating a decelerating flow and pressure gradient.
Fig. 13 (a) represents suction side pressure at 2720 rpm. The pressure gradient at 2720 rpm compared to 2040 rpm is steeper. Due to adverse pressure gradient at leading edge, the boundary layer got separated causing a low pressure at LE. At higher rotational speed, the flow moves faster so the pressure rise is higher in contours of 2720 rpm, causing suction effect. At LE, due to stronger suction forces, the low-pressure region near the LE at 2720 rpm extends deeper as compared to 2040 rpm. The low-pressure region at LE depicts that flow separation occurred on the suction side at 2720 rpm. Moreover, the chaotic velocity streamlines indicate turbulent behavior of flow on the suction side. In Fig. 13 (b) the pressure side at 2720 rpm is shown. Here pressure dropped initially, then it increased at the end of mid-span and it continued to increase until the flow left the TE. Smooth streamlines indicate a uniform nature of flow at the pressure side.
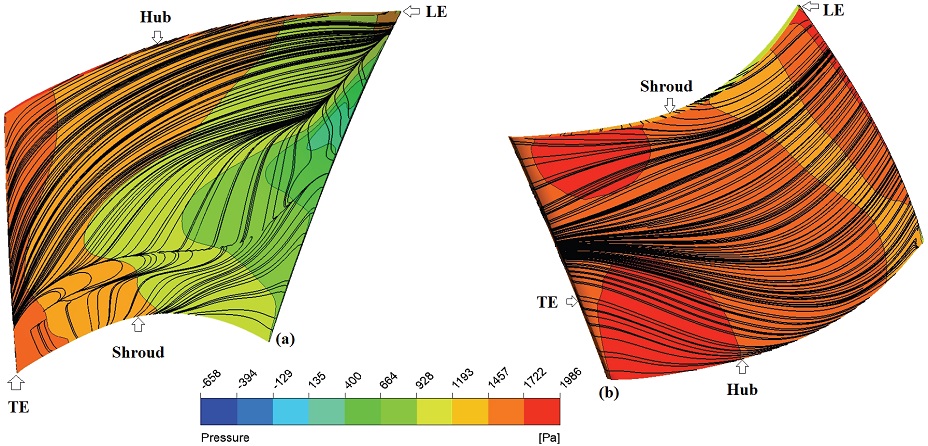
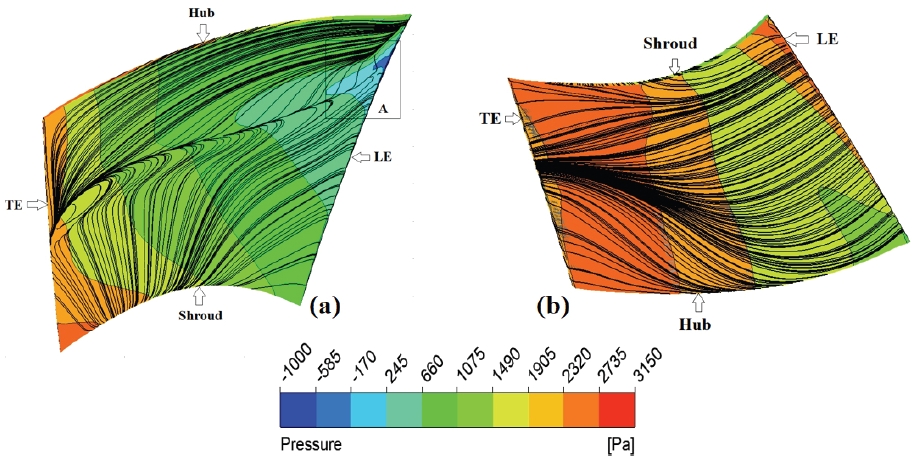
Fig. 14 (a) shows pressure distribution on the suction surface at 3214 rpm. As the flow entered the leading edge of the blade, it experienced an adverse pressure gradient near the hub section. This is due to the high blade curvature on the suction side. The flow underwent significant turning which led to a stronger suction effect and the air accelerated rapidly, causing a significant pressure drop Owing to this reason, a low-pressure region is formed near the hub which is highlighted as region (A) in Fig. 14 (a).
The same suction effect can also be validated through the blade loading plot at 20% span in Fig. 10 (a). Also in Fig. 14 (a), region (A) also highlighted flow stagnation as here the streamlines are not moving forward with the mainstream. In region (A) flow separation exists as both pressure and velocity are dropped. In the mid-chord region, the pressure increased marked by a green contour. Also at mid-chord, it is observed that the velocity streamlines are twisted, indicating flow deceleration. In accordance with Bernoulli's Principle, as the flow moved toward trailing edge, it slowed down substantially causing a considerable rise in pressure. The high pressure at TE is marked by an orange color. Compared to lower speeds, the centrifugal forces are stronger at 3214 rpm owing to higher speed. Because of this reason, the velocity streamlines are chaotic at trailing edge, indicating adverse pressure effects happening at trailing edge.
On the pressure side of the blade in Fig. 14 (b), at the LE, the flow accelerated sharply as it moved over the blade surface. The streamlines are thick, which indicates a higher velocity at LE and relatively low pressure. The air pressure started to increase (yellow color) after flow decelerated due to blade twisting. Near trailing edge, the fluid slowed down which resulted in a pressure rise (red mark). From flow field behavior described in section 5.5, it is obvious that the blade shape can be optimized further to achieve maximum static pressure.
5.6 Pressure distribution through inlet to fan outlet
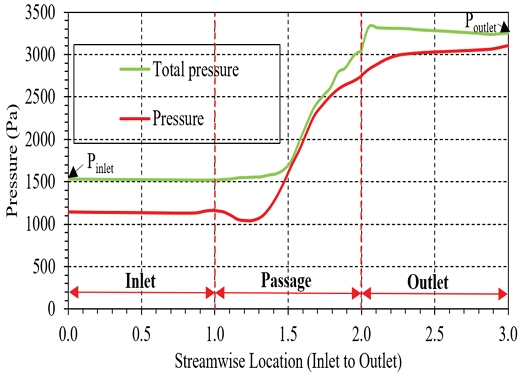
Fig. 15 represents pressure distribution from inlet to outlet. Pressure remains constant between stream-wise 0.0∼ 1.0 as flow is in inlet condition. As the fluid passed through the passage (1.0 to 2.0), we observed an increase in both static pressure (red line) and total pressure (green line). This increase is due to the energy imparted by the fan blades to the airflow, raising both the static and dynamic pressures. The fluid decelerated, converting kinetic energy into static pressure. The sudden jump in total pressure after location 2.0 involved multiple factors. At the impeller exit, the fluid has received the full work input from the blades, manifested as a sharp increase in total pressure. Also at 2.0, the transition from a rotating frame to a stationary frame occurred. Inside the impeller (rotating frame), the total pressure includes more static pressure with a little relative dynamic pressure. At impeller exit (stationary frame), total pressure also included the dynamic pressure due to wheel speed. This is attributed to a sudden increase in total pressure at 2.0. Towards outlet, the static pressure rises more rapidly, after stream-wise 2.0, down in the outlet section. This implies that most of the dynamic pressure has been converted to static pressure.
5.7 Velocity vectors from inlet to fan outlet
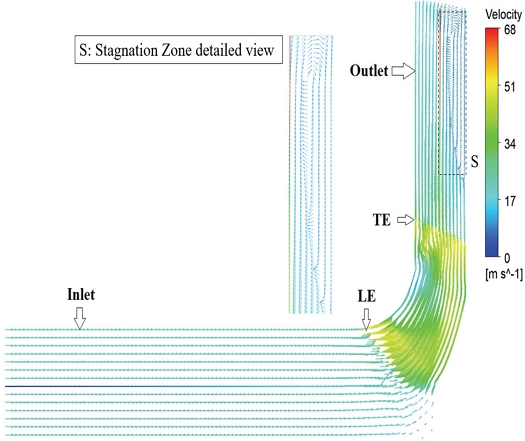
Fig. 16 shows the velocity vectors through inlet section to outlet of fan. The flow accelerated at leading edge of the blade (yellow vectors) and then slowed down at mid-section of blade (green marks).
It means the mid-section provided the static pressure rise. The same can be validated by looking at passage section in Fig. 15 at location 1.5, a rising red line indicating an increase in static pressure. There are many low-velocity vectors near shroud which shows that, due to steep shroud curvature, the phenomena of flow separation have occurred at shroud. Moreover, it is obvious from the velocity vectors that the flow is more accelerated in hub region, having yellow marks dominant in this section. Some velocity vectors are scattered at trailing edge, indicating adverse pressure gradient existed at trailing edge. After the trailing edge, when flow entered in outlet section. The flow area is increased, and the fluid decelerates which causes an adverse pressure gradient. In the near wall, a region named “S”, is a stagnation zone where flow velocity is reduced significantly which formed a re-circulation region. The “S” region has many vectors moving in a backward direction towards the impeller. The reversing flow reduced the overall momentum in the flow direction. As main flow interacted with re-circulation zones. This caused turbulent mixing losses, which resulted in energy dissipation in this stagnation zone. Due to these losses, pressure rise through the fan, and fan efficiency is reduced. The existing design needs optimization of the outlet section to provide a more gradual increase in the outlet area.
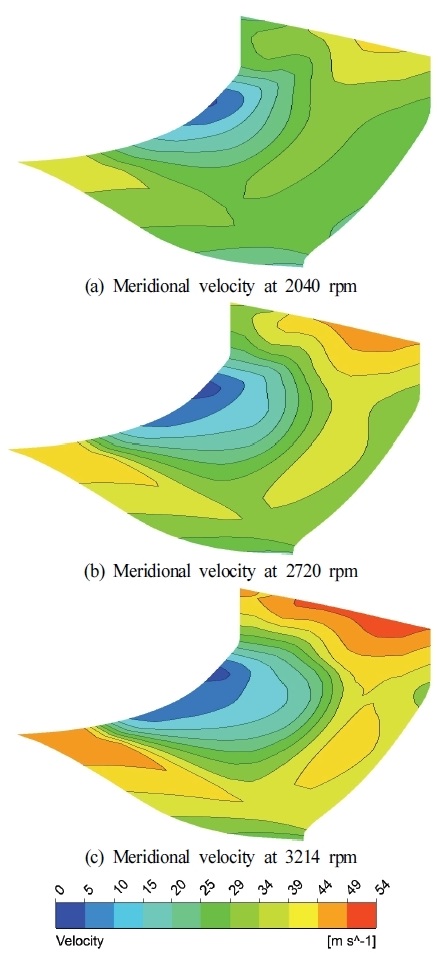
5.8 Comparison of meridional velocities on meridian surface at different rotational speeds
The meridional surface represents the shape of the impeller's hub, shroud, inlet and outlet. In Fig. 17, the meridional velocities are shown for different wheel speeds.
Fig. 17 (a) shows velocity distribution on meridional surface at 2040 rpm. A stagnation region is observed on shroud side due to weaker centrifugal force in this area. This caused an adverse pressure gradient in this region.
Fig. 17 (b) represents the meridional velocity at 2720 rpm. Similar flow stagnation is observed on shroud. But it is a little more pronounced as compared to stagnation observed at 2040 rpm.
Fig. 17 (c) presents the velocity distribution on meridional surface at 3214 rpm. The velocity distribution showed variation due to pressure gradient. At the shroud near the trailing edge, a stagnation zone is formed. This zone resulted in flow stagnation and caused energy losses. However, at 3214 rpm this stagnation region is smallest because at higher rpm the centrifugal forces are stronger which helps to push the air outward with greater momentum. Moreover, here the stagnation region is localized at shroud only and does not expand in other regions. The flow recovered from stagnation and the onward accelerated flow helped to induce pressure recovery on the fan outlet.
6. Concluding remarks
The study presented the primary design procedure and aerodynamic analysis of a 3kW class ECM fan impeller. The novel aspect of this research lies in the detailed description of design methodology, which provides valuable insights for impeller designers on how to use empirical relations for fan design. The key outcomes of this study are as follows.
- (1) Utilizing non-dimensional coefficients in design process is a central tool for impeller design. The coefficients enabled a physics-based approach to balance fan efficiency and aerodynamic performance.
- (2) The Cordier diagram, an empirical guideline based on non-dimensional coefficients, was used during the design phase to pinpoint the best efficiency point for the fan. In this way, the current design approach distinguished itself from the traditional approach that often rely entirely on trial and error.
- (3) Performing CFD analysis of centrifugal mixed-flow fan on different flow rates and different rotating speeds resulted in generation of accurate fan performance curves e.g., efficiency versus flow rate, power versus flow rate, etc. These curves provided a comprehensive view of the fan's performance over a range of operating points.
- (4) As determined from the CFD results, there were energy losses due to flow separation. We aim to employ optimization techniques in the future such as blade shape optimization, LES to accurately model turbulent flow. These strategies will help to reduce separation and will improve fan performance.
- (5) In the future fan design transient analysis will be carried out to see variations in fan performance taking into account the phenomenon of flow separation in detail. Moreover, we also plan to conduct a parametric study on the internal motor design integrated into the EC fan assembly, as well as the clearance of the bell mouth at the fan inlet.
Nomenclature
| CFD : | Computational Fluid Dynamics |
| LES : | Large Eddy Simulation |
| Ds : | Specific Diameter |
| D : | Impeller Tip Diameter |
| Ns : | Specific Speed |
| N : | Rotation Speed |
| M : | Million |
| Ps : | Static Pressure |
| Pt : | Total Pressure |
| Pin : | Input Power |
| ΔPt : | Total Pressure Difference |
| LE : | Leading edge of blade |
| TE : | Trailing edge of blade |
| u1 : | Peripheral velocity leading edge |
| u2 : | Peripheral velocity trailing edge |
| H : | Pressure head |
| β1 : | Entry angle at blade's leading edge |
| β2 : | Exit angle at blade's trailing edge |
| b2 : | Blade width at outlet at impeller |
| Poutlet : | Total pressure at outlet |
| Pinlet : | Total pressure at inlet |
Acknowledgments
This work was supported by the Korea Institute of Energy Technology Evaluation and Planning (KETEP) grant funded by the Korea government (MOTIE) (RS-2024-00420625, Development of high efficiency industrial fan system technology in response to energy efficiency regulations).
References
- George Riker, “EC motors explained”, ebmpapst.com, , November 2013. [Online]. https://www.ebmpapst.com/content/dam/ebm-papst/loc/americas/technical-articles/EC%20Motors,%20Explained.pdf, . [Accessed October 12, 2024]
- “EC motors & fan applications technical article”, continentalfan.com, , August 2023. [Online]. https://continentalfan.com/wp-content/uploads/2023/08/EC-Motors-Fan-Applications-Technical-Article.pdf, . [Accessed October 12, 2024]
- Lou Moffa, “EC motors revving up big HVACR advantages”, ebmpapst.com, , July 2018 [Online]. https://www.ebmpapst.com/content/dam/ebm-papst/loc/americas/technical-articles/EC%20Motors%20Revving%20Up%20-%20Big%20HVACR%20Advantages.pdf, [Accessed October 12, 2024]
- “Electronically Commutated (EC) Fans Market”, infiniumglobalresearch.com, , March 2024. [Online]. https://www.infiniumglobalresearch.com/market-reports/global-electronically-commutated-ec-fans-market, [Accessed October 12, 2024]
- Engineering 360 media solutions, “Rethinking centrifugal fan selection”, ebmpapst.com, , July 2018 https://www.ebmpapst.com/content/dam/ebm-papst/loc/americas/technical-articles/Rethinking%20the%20Centrifugal%20Fan%20Selection.pdf, , [Accessed October 12,2024]
-
L. Newborough, M. Newborough, S.D. Probert, “Electronically commutated direct-current motor for driving tube-axial fans: A cost-effective design”, Journal of Applied Energy, Vol. 36, Issue 3, pp. 167- 190, 1990
[https://doi.org/10.1016/0306-2619(90)90011-2]

- Kerstin Lesley Kenty, “Use of Electronically commutated motors (ECMs) in air terminal units”, Conference proceeding DA-07-035, Total Pages 8, The American Society of Heating, Refrigerating and Air-Conditioning Engineers (ASHRAE), 2007
-
Ho-Chiao Chuang, Jung-Hung Chi, Kuei-Yuan Chang, “Study on a fan coil unit and chiller by an intelligent control method with stepless variable speed driving technology”, The International Journal of Building and Environment (132), ScienceDirect, pp. 137∼ 146, 2018.
[https://doi.org/10.1016/j.buildenv.2018.01.033]

- T. Wright, Fluid machinery: Performance, analysis, and design, CRC Press LLC (1999), pp 54∼64, pp. 125-133.
- Frank P. Bleier, Fan Handbook: Selection, application and design, 1998. Chapter 7, 14, section 7.17∼7.21, section 14.1 ∼ 14.7
- Bruno. ECK. 1973, “Fans Design and Operation of Centrifugal, Axial-flow and Cross-flow Fans”, 1st Edition, Pergamon Press, pp 57-59, page 100.
-
Sayed Ahmed Imran Bellary, Abdus Samad, “Centrifugal Impeller blade shape optimization through numerical modeling”, The International Journal of Fluid Machinery and Systems, Vol. 9, No. 4, October- December 2016.
[https://doi.org/10.5293/IJFMS.2016.9.4.313]

- CFturbo GmbH, “Outlet triangle”, Available: https://manual.cfturbo.com/en/bl_te.html
- S M Yahya, “Turbines Compressors and fans”, 2nd edition, Tata McGraw-Hill Publishing Company, page no. 650, Chapter no. 15, section no. 15.3.3.
- CFturbo GmbH, “Global setup”, Available: https://manual.cfturbo.com/en/index.html?global_setup.html
- CFturbo GmbH, “Meridional contour”, Available: https://manual.cfturbo.com/en/index.html?mercon.html
- ANSYS, “ANSYS CFX-Pre-User’s Guide,” Software Handbook, Release 15.0, ANSYS Inc, Canonsburgre, PA, USA, 2013.
-
I. B. Celik, U. Ghia, P. J. Roache, C. J. Freitas, H. Coleman, and P. E. Raad, “Procedure for estimation and reporting of uncertainty due to discretization in CFD applications,” Journal of Fluids Engineering, Vol. 130, No. 7, 2008.
[https://doi.org/10.1115/1.2960953]

- ANSYS Inc, “ANSYS CFX Tutorials,” Software Handbook, Release 14.0, Canonsburgre, USA, 2011.

