Cavitation Characteristics of a Pump-turbine Model by CFD Analysis
Abstract
The pumped storage plant operates with quick change of the discharge as well as quick changes between pump mode and turbine mode. This study focuses on the cavitation analysis of a pump-turbine model because in turbo-machinery, cavitation can reduce the performance and shorten service life. The pump-turbine model system consists of 7 blades, 20 stay vanes (including tongue) and 20 guide vanes. This study adopts the Rayleigh-Plesset model as a cavitation model, which illustrates cavitation by using the air volume fraction method. The pump mode and turbine mode at the operating condition of partial loading, normal and excessive loading are analyzed to investigate the cavitation performance of the pump-turbine. It was observed that this pump-turbine design showed very good cavitation characteristics with no cavitation bubbles in all operating conditions. Overall value of air volume fraction of both mode at different operating condition are lower than 1, which confirms low possibility of cavitation occurrence at current situation.
Keywords:
Pump-turbine, Operating Conditions, Cavitation, Air Volume Fraction, CFD키워드:
펌프 터빈, 운전 조건, 캐비테이션, 공기체적비, 전산유체역학1. Introduction
The pumped storage plant operates with quick change of the discharge as well as quick changes between pump mode and turbine mode. Various problems such as noise, vibration and pressure instability will have great effect on the plant, influencing on the hydrodynamic component, abrasion and performance decrease. Furthermore, it may even cause serious safety incident. Cavitation regularly appears when the system is operating at high and low discharge flow and is the major factor of inducing component abrasion, decreasing the machines performance and stability.
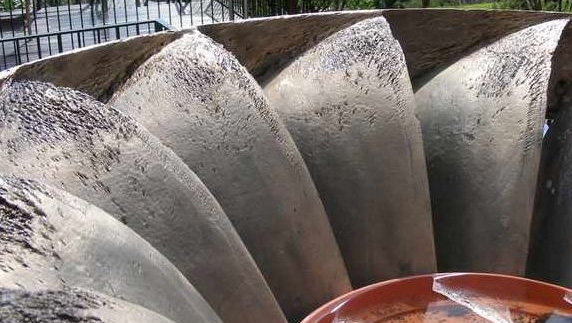
An example of impeller abrasion is shown in Fig. 1(1). Previous studies have been conducted by the following authors validating that CFD methods provide satisfactory results; Kerschberger(2) presented the cavitation performance of a high-speed pump-turbine by using Thoma cavitation coefficient based on the CFD analysis; Liu(3) explored the relationship of pump characteristic and cavitation performance in pump-turbine. The cavitation performance can be successfully simulated by using k-ω SST turbulence model.
This study focuses on the cavitation analysis of a pump-turbine model because in turbo-machinery, cavitation can reduce the performance and shorten service life. Therefore, it is important to study its effect on the current pump-turbine model to gain a better understanding of the pump-turbine system.
2. Pump-turbine model and Numerical methods
2.1 Pump-turbine model
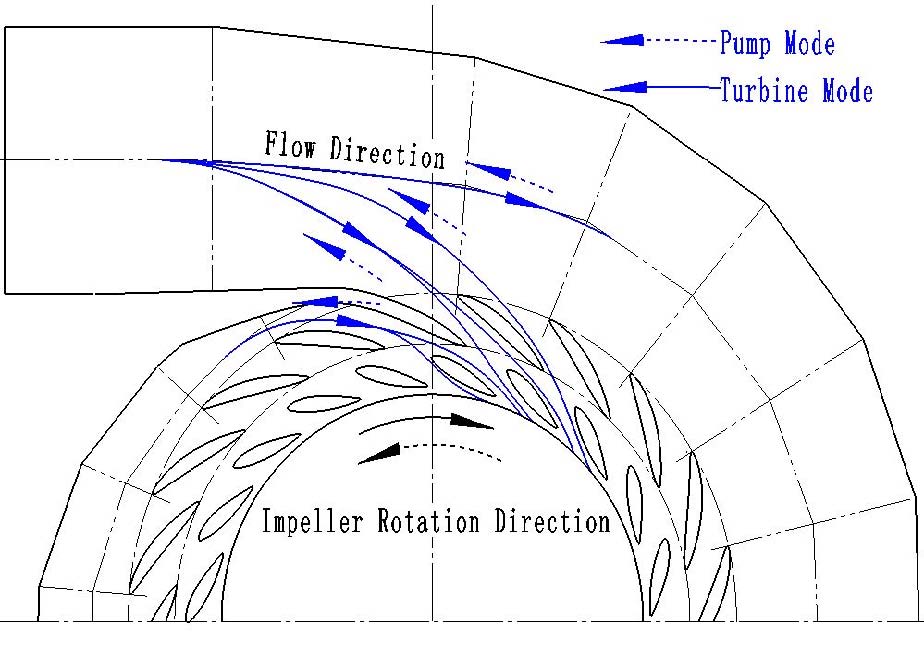
The operational model of the pump-turbine system is illustrated in Fig. 2. The 100 kW pump-turbine has H=32 m, Q=0.336 m3/s and N= 200 min-1. The system consists of 7 blades, 20 stay vanes (including tongue) and 20 guide vanes. The design method used is similar to one suggested by Wang et al(4).
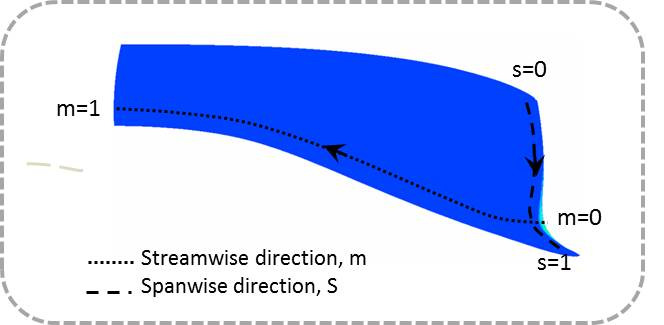
The blade shape and curvilinear coordinate are presented in Fig. 3, showing the streamwise (m=0, m=1) and spanwise (s=0, s=1) directions, respectively.
2.2 Numerical methods
Various numerical simulation methods are available from the past decade, which have been discussed in detail by Liu(5), Yang(6) and Hasmatuchi(7). Cavitation performance can be preliminary predicted by comparing the local static pressure on the impeller blade surface, where the possibility of cavitation occurrence is mostly high, with the saturation pressure (3.57×10³ Pa at 25℃). The cavitation model in CFD analysis is based on the assumption that the water and vapour mixture in the cavitating flow can be modeled as a homogeneous fluid. Therefore, current study adopts the Rayleigh- Plesset model as a cavitation model, which illustrates cavitation by using the air volume fraction method(8).
Table 1 presents the numerical methods and boundary conditions of the cavitation analysis and Table 2 shows the various operating conditions that were conducted for the cavitation analysis.
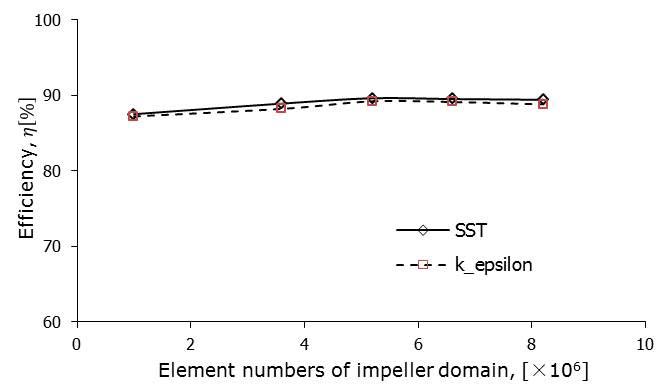
Figure 4 presents the CFD validation test that was carried out according to different element numbers and turbulence models. The SST turbulence model is selected for all calculations in this study because it is generally used for rotating applications like pumps and turbines and shows relatively better convergence in contrast to the other models.
3. Results and Discussion
3.1 Performance curves
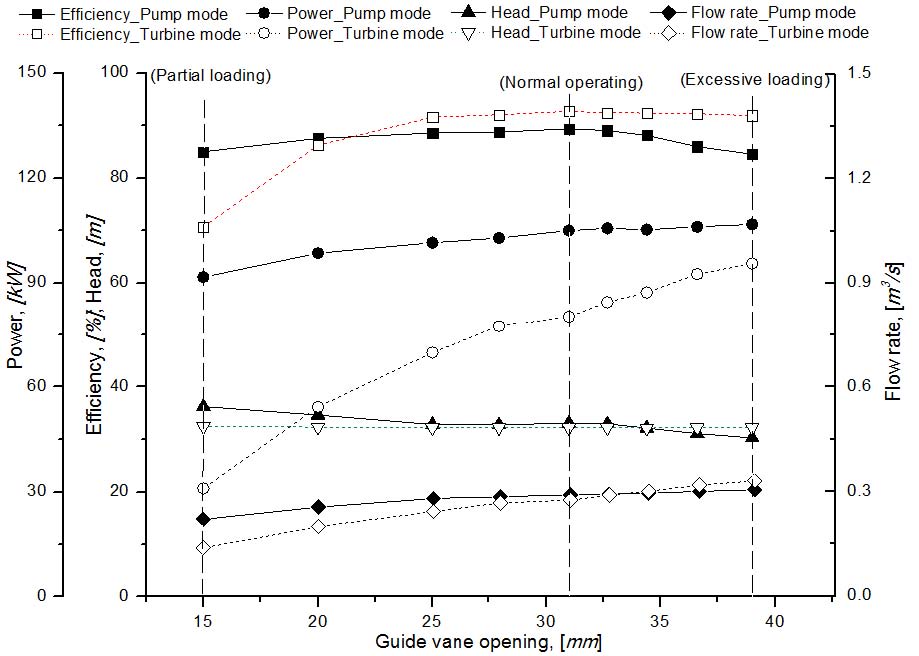
The pump-turbine systems performance when it operates at pump mode and turbine mode are presented in Fig. 5. The performance curves of the turbine mode are investigated by keeping the head fixed and adjusting the guide vane opening to obtain a performance curve including the operating conditions of partial, normal and excessive loading.
For the pump mode, the best efficiency (89.4%) appears at the guide vane opening of 31 mm, flow rate 0.29 m3/s, head 33.13 m and power 104.9 kW, defined as normal operating condition. For the turbine mode, the performance curves also presents the best efficiency (92.6%) at the guide vane opening of 31 mm, with flow rate 0.28 m3/s, head 32.24 m and power 80.29 kW.
3.2 Comparison of static pressures of the flow passage on both pump and turbine modes
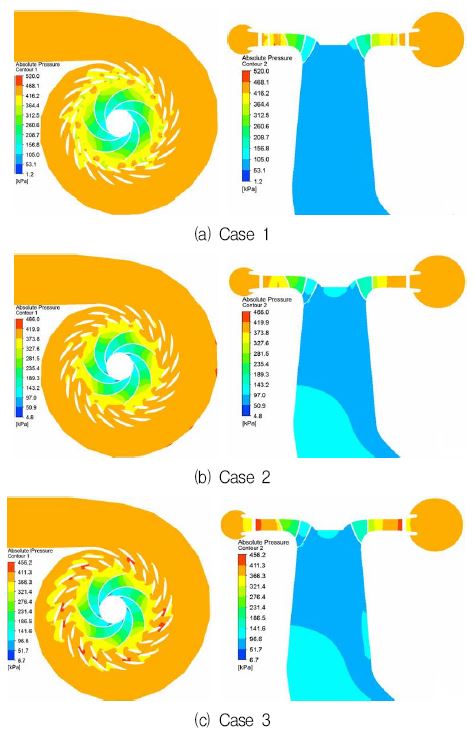
The static pressure distribution on the whole flow passage was studied for the pump mode and turbine mode. Figure 6 shows the partial, normal and excessive loading cases 1 to 3, respectively in the pumping mode. Case 1 presents low distribution of pressure across the passage. However as the loading increases to normal condition (case 2) and excessive loading (case 3) it is observed that the pressure at the inlet increases significantly and the draft tube also experiences an increase in pressure. However, the pressure difference at inlet and outlet seems to be reduced as the loading increases.
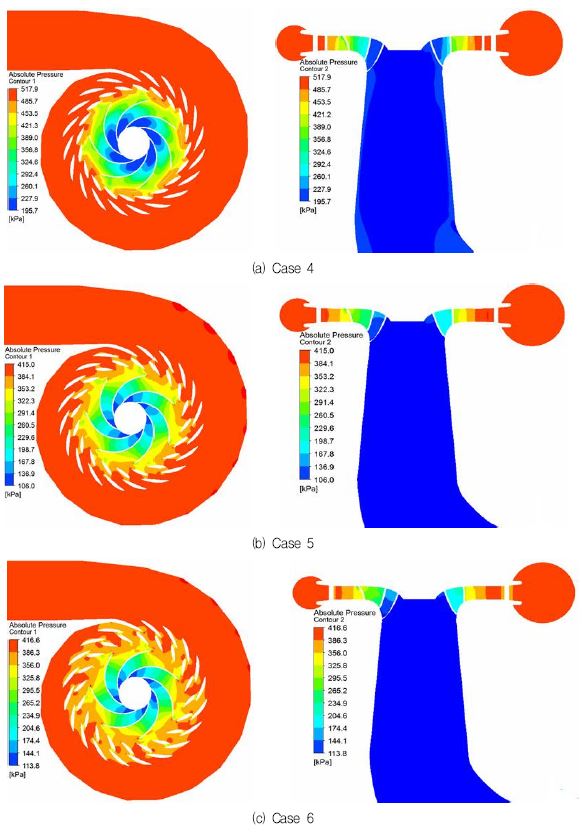
In the turbine mode, Fig. 7 presents the distribution of the pressure across the whole passage. It is observed that the pressure difference at inlet and outlet is much greater for the partial loading (case 4) in contrast to the normal (case 5) and excessive loading (case 6). It can be conjectured that as the loading increases the pressure difference is reduced in the turbine mode. Both modes show that pressure difference at inlet and outlet is reduced as loading increases.
3.3 Investigation of pressure distribution and air volume fraction on the blade surface
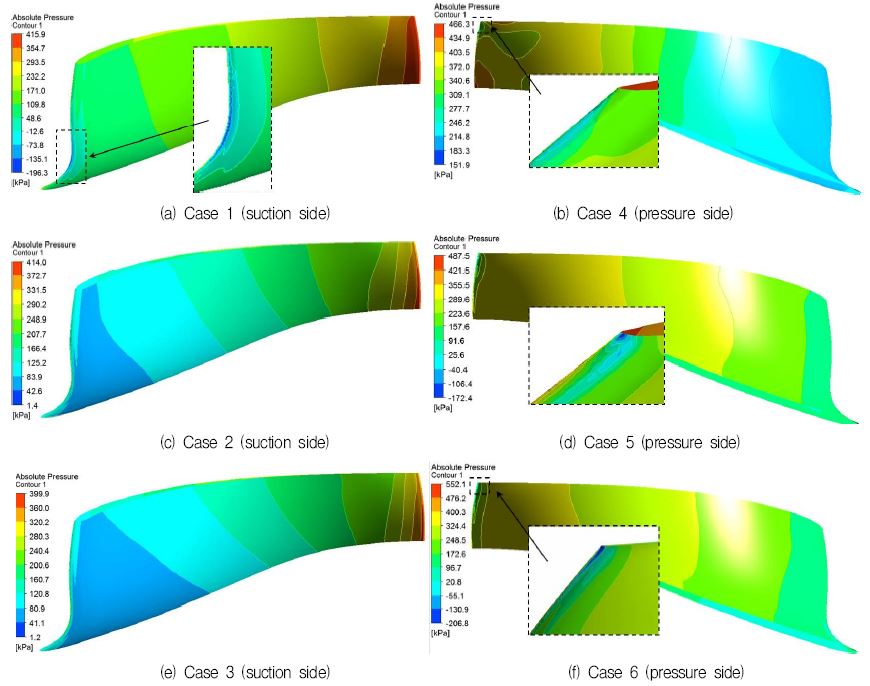
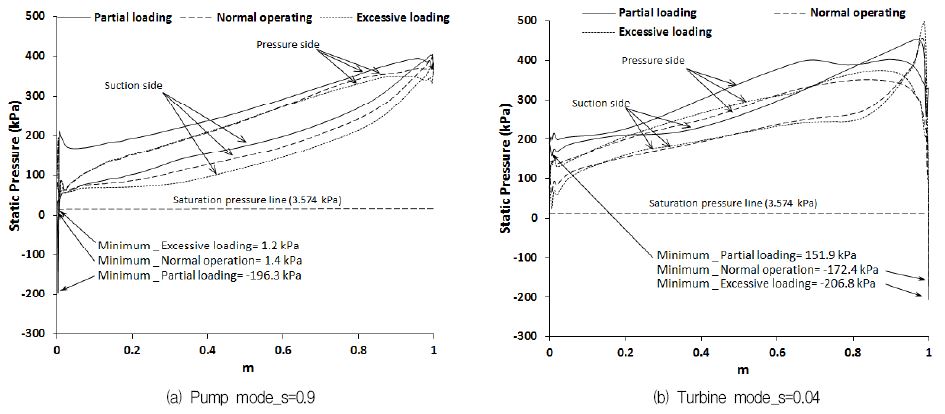
The pump mode and turbine mode at the operating condition of partial loading, normal and excessive loading are analyzed to investigate the cavitation performance of the pump-turbine. Figures 8 and 9 show the pressure contours and distribution on the blade surface at both modes, respectively. The pressure gradient changes regularly at the blade surface, and the minimum pressure appears at the blade low pressure side of pump mode, and relatively low pressure in the turbine mode appears at the blade tip of high pressure side.
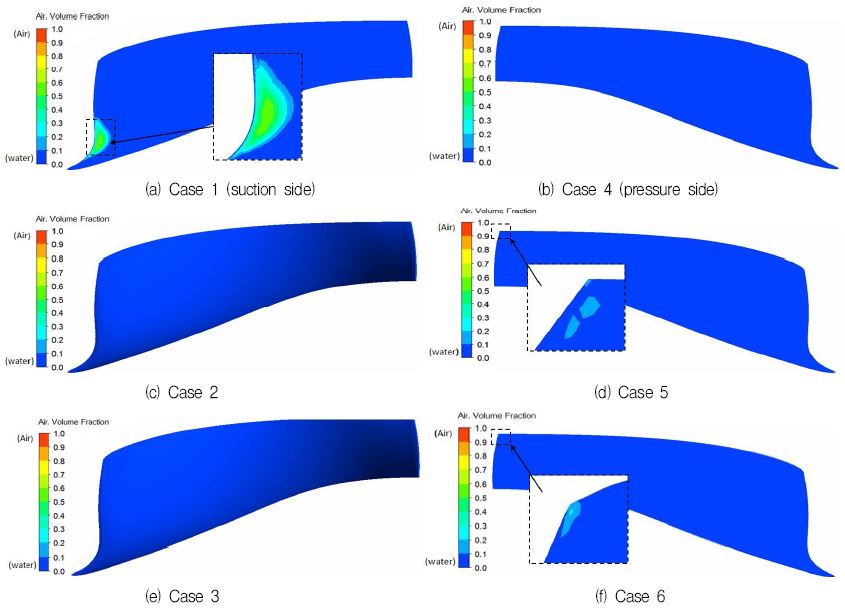
The corresponding air volume fraction distribution on blade surface is shown in Fig. 10. The value of volume fraction 1 means that the bubbles are completely formed and cavitation occurs but the value of 0 means there is only water. The value between 1 and 0 is mixture.
The small area in the blade low pressure side of partial loading pump mode is presented with air volume fraction between 1 and 0, and only in the suction side, but still under the limitation of no cavitation. Only a very small area in blade tip of turbine mode shows the different color, indicating no significant possibility of cavitation occurrence.
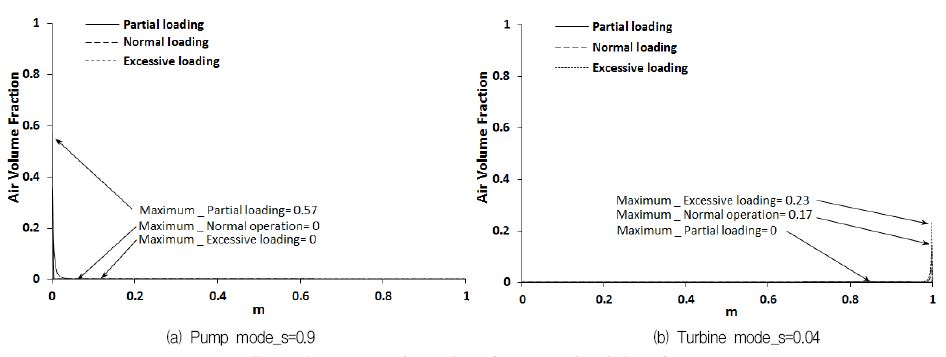
Furthermore, in order to accurately investigate the cavitation performance at pump mode and turbine mode, the static pressure and air volume fraction distribution on the blade surface of spanwise s=0.9 for pump mode and s=0.04 for turbine mode are plotted as shown in Fig. 11, where the minimum pressure and mixture value of air volume fraction is found on each mode. The abscissa in Fig. 11 presents the investigation range from blade low pressure side to high pressure side (m=0 to m=1).
The partial loading of pump mode shows the largest value of air volume friction, 0.57 and a relatively small static pressure, which is much lower than the saturation pressure. The other two operating conditions show a close value of static pressure.
For the turbine mode, at the operating condition of normal and excessive, the air volume friction are 0.17 and 0.23. The static pressure shows the value is lower than the saturation pressure at the two conditions. But the overall value of air volume friction of both mode at different operating condition are lower than 1, which confirms low possibility of cavitation occurrence at current situation.
4. Conclusions
The cavitation analysis for a pump-turbine model was carried out in detail using CFD methods. The pressure coefficients and air volume fractions were investigated and compared. From the results, it can be concluded that this pump-turbine design showed very good cavitation characteristics with no cavitation bubbles in all operating conditions. Overall value of air volume fraction of both modes at different operating condition are lower than 1, which confirms low possibility of cavitation.
References
- Grein, H. K., and Bauman, M. L., (1975), “Commissioning Problems of A Large Pump Turbine”, Water power and dam construction, 12(457).
-
Kerschberger, P., and Gehrer, A., (2010), “Hydraulic Development of High Specific-speed Pump-turbines by Means of an Inverse Design Method, Numerical Flow-Simulation (CFD) and Model Testing,”, IOP Conf. Series: Earth and Environmental Science, 12(012039).
[https://doi.org/10.1088/1755-1315/12/1/012039]

-
Liu, J. T., Liu, S. H., Wu, Y. L., Jiao, L., and Wang, L. Q., (2012), “Numerical Investigation of the Hump Charactertistic of Pump-turbine Based on an Improved Cavitation Model”, Jour. Computers & Fluids, p105-111.
[https://doi.org/10.1016/j.compfluid.2012.08.001]

- Wang, X., Zhu, B., and Tan, L., (2014), 3D Inverse Design and Performance Investigation of a Pump- Turbine Runner, Transactions of the Chinese Society for Agricultural Machinery, in press, (in Chinese).
-
Liu, J. T., Liu, S. H., and Sun, Y. K., (2013), “Three dimensional Flow Simulation of Transient Power Interruption Process of a Prototype Pump-Turbine at Pump Mode”, Journal of Mechanical Science and Technology, 27, p1305-1312.
[https://doi.org/10.1007/s12206-013-0313-6]

- Yang, L., Cheng, N. X., and Fan, H. G., (2006), “3-D Two-Way Numerical Simulation and Performance Estimation on the Whole Flow Passage of the Reversible Pump-Turbine Runner”, Engineering Mechanics, 23, p157-162.
- V. Hasmatuchi, Roth, S., and Botero, F., (2011), “Hydrodynamics of a Pump-Turbine at Off-Design Operating Conditions: Numerical Simulation”, ASMEJSME- KSME 2011 Joint Fluids Engineering Conference, American Society of Mechanical Engineers, p495-506.
- ANSYS Inc, (2013), “ANSYS CFX Documentation”, Ver. 13, http://www.ansys.com.
