An Estimation of Performance Test and Uncertainty of Measurement for a Large Axial-flow Fan Based on ANSI/AMCA 210 Standard
In general, a large-capacity axial flow fan is used for industrial processes or ventilation in a social overhead capital infrastructure. The main characteristics of the large axial-flow fan need a lot of electrical power consumption and operate 24 hours a day, 365 days a year. Since the large axial flow fan consumes several hundreds to thousands kW per hour, both manufacturer and consumer are struggling to select high efficiency products for saving energy and reducing operation cost. Therefore, the performance testing should be accurately conducted in experimental equipments. The performance estimation and uncertainty of measurement of the axial-flow fan gathered from the result from nozzle shaped testing equipments certified with ANSI/AMCA standard and duct shaped testing equipment under the same experimental condition. The experimental results from both facilities have maximum 17% differences in performance evaluation and uncertainty of measurement. As considering that the differences, it is doubt about the reliability of testing result. The test was repeated with the specific term during 12 months because it is important to fully reflect the real conditions and to decide the repeatability of data. The evaluation of duct type testing facilities was failed to get an uncertainty measure. Testing results were previously published. As a series of previous paper, axial fan (∅1690 mm) and duct type testing facilities were fabricated. The purpose of fabricating testing equipment was testing an uncertainty measurement under the controlled environments.
Keywords:
Axial flow fan, Pitot tube, Nozzle chamber, Data repeatability, Measurement uncertainty, 축류홴, 피토관, 노즐챔버, 데이터 재현성, 측정불확도1. Introduction
Fan system has to be designed and selected for intended usage. For enhancing energy efficiencies, fan should be adjusted with whole system with proper installation and operation. The main characteristics of the large axial-flow fan are large diameter and flow rate. Also it consumes a lot of electrical power consumption and operates 24 hours a day, 365 days a year. Since the large axial flow fan consumes several hundreds to thousands kW per hour, both manufacturer and consumer are struggling to select high efficiency products for saving energy and reducing operational cost. Therefore, the performance testing should be accurately conducted by reliable experimental equipment.
Although the testing accuracy using inlet chamber setup is more accurate than inlet duct setup, testing is rarely conducted in the inlet chamber setup in industrially purposed large axial fan. The reasons are the cost of inlet chamber setup is tremendously expensive and the number of inlet chamber applicable to large axial fan is limited. The purpose of this paper is comparing and analyzing the air performance of large axial fan at the Inlet chamber setup and inlet duct setup.
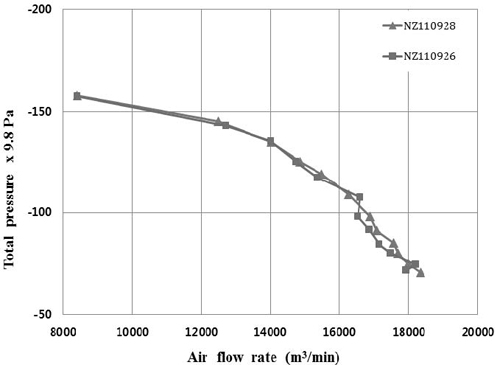
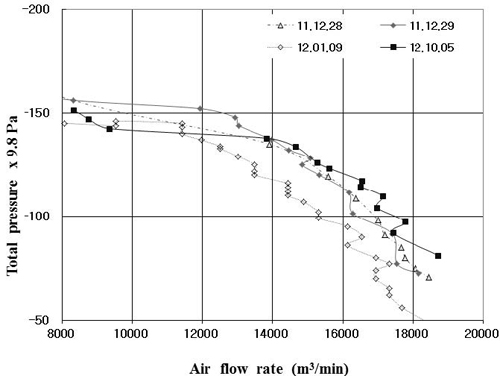
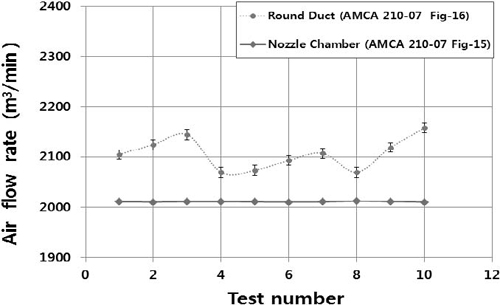
The test was repeated with the specific term during 12 months because it is important to fully reflect the real conditions and to decide the repeatability of data. During the test, the large axial fan was tested in the AMCA accredited Inlet chamber and Inlet duct setup installed outside of building. The inlet chamber setup showed(Fig. 1) the high repeatability (±1.6%) which amount is lower than the AMCA.(Air Movement and control Association International, Inc., Arlington Height, USA) check test tolerance. Since the test result from the inlet duct setup(Fig. 2) show up to 17% differences with inlet chamber setup, we concluded that the calculating measurement of uncertainty conducted in inlet duct setup was infeasible.(1) As a series of previously published paper, the purpose of this paper is the estimation of uncertainty measurement of inlet duct setup under the controlled environments. Therefore, the air performance, flow rate variation by the changing the pitot tube angle, repeatability are compared and analyzed in this paper. The test results are analyzed based on ANSI/AMCA 210-07, Annex F. Uncertainties Analysis.(2)
2. Testing facilities and calibration
2.1. Specification of test facilities and purpose of testing
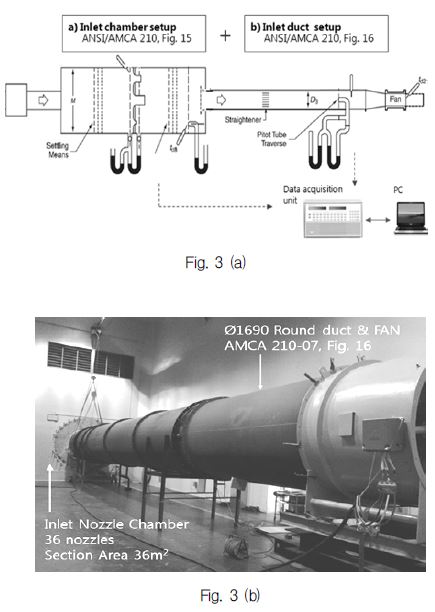
The detailed specification of testing facilities is on the following table 1. The testing facilities are multi nozzle chamber (Fig. 3a) as a standard equipment, inlet duct setup (Fig. 3b) equipped with pitot tube array for the purpose of comparing air flow rate, and axial flow fan as a test object. The detailed installation of testing facilities is in the following Fig. 3. multi nozzle chamber adopt the flow nozzle for measuring differential pressure. The area of cross section at the measuring point was 6000 mm x 6000 mm. The inlet chambers are not affected with the external environment. The inlet chamber setup is accredited from AMCA. The diameter of duct was 1690 mm which is equal with the diameter of fan. Inside the duct, the pitot tubes are parallel arranged for measuring the pressure as shown in the Fig. 5.
In this test, the air flow was measured in two different testing facilities, inlet chamber and inlet duct. The inlet chamber setup was intended for the standard air flow meter. The amount of air flow, repeatability and the errors of air flow rate caused by changing the pitot tube angles were measured in both testing facilities.
2.2. Inlet chamber setup and calibration test
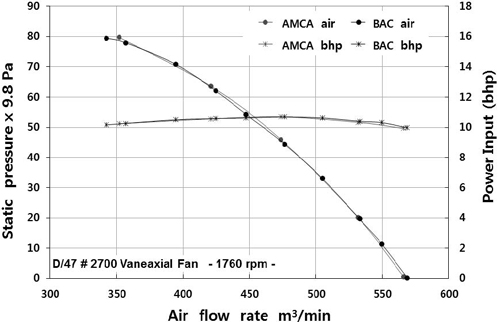
The testing facilities (Fig. 3 a) are internationally accredited as independent Accredited laboratory(3) after getting accreditation form AMCA. Also it is registered as KOLAS(Korea Laboratory Accreditation Scheme, South Korea(4)) and accredited laboratory from KATS (Korean Agency for Technology and Standards). For filing up traceability, the testing facilities regularly conducted comparison test with testing facilities at AMCA. An axial flow fan up to ∅3000 mm can be tested in the facilities installed at BAC(Kiturami Bumyang Air Conditioning Co., Ltd.), South Korea. The air flow rate calculated from the measurement of differential pressure between inlet and outlet of nozzle. The specific nozzle combinations were used for measuring the differential pressure. The test facility makes possible to reduce error from pressure measurement. By adjusting an external static pressure, the nozzle chamber setup is rarely affected by an external environment. For this test, the test facilities were corrected according to the ISO/IEC 17025.(5) The result of comparison test is on the following table 2. Also, we can conclude that the pressure, air flow rate, required power curve are accord with the test results from AMCA as shown in Fig. 4.
3. Testing Method
3.1. Inlet chamber setup
Since inlet chamber setup used as standard, for this experiment, it requires the calibration. The calibration results are shown in the Fig. 4.
3.2. Inlet duct setup
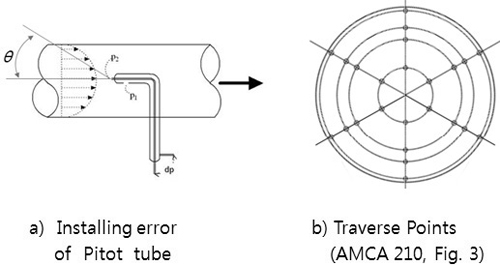
The inlet duct setup was equipped with pitot tube to measure the total pressure(Pt) and static pressure inside of inlet duct. A manometer was connected with pitot tube for measuring differential pressure (d/p). The velocity pressure and air flow rate were calculated from the differential pressure. Each pitot tubes were parallelly connected at specific locations for obtaining an average velocity (Fig. 5). Since installation errors could arise from the angle of pitot tube, the degree of pitch angle and yaw angle were corrected repeatedly. Furthermore, the degree of pitot tube array could be adjusted as needed. The duct diameter of testing facilities and testing specimen were equivalent in the dimension (∅1690mm).
The calculation of air flow rate with pitot tube array can be expressed as following equation (1) and (2):
here:
A3 Cross-section area of Inlet duct setup [m2]
tdx Air temperature at plane x (x=1, 2) [℃]
ΔP Differential pressure [Pa]
Px Air density at plane x (x=1, 2, 3) [kg/m3]
Pv3 Velocity pressure [Pa]
Q Air flow rate [m3/min]
In the whole test, we assumed that the air flow rate obtained from inlet duct set is under allowable tolerance level from AMCA standard. The uncertainty measurement of measured air flow rate was estimated based on AMCA 201-07.
3.3. Analysis for air flow rate
The purpose of testing is comparing the air flow rate measured from inlet duct setup and nozzle chamber setup as standard. The ideal case is the air flow rate is corresponding in both facilities. As comparing that the test result from the inlet duct setup and nozzle chamber setup the differences of air flow rates was ranged from 5% to 14% as shown in table 3. The highest differences between two testing facilities were observed at high total pressure and low air flow rate condition. Since the testing tolerance(6) was ranged from -2.5% to 1.25% (AMCA 111-99), the reliability of testing result acquired from the inlet duct setup using pitot tube was very low. The test result from two testing facilities measured simultaneously is on the following table 3 a) and b). The total pressure (Pt) and air flow rate (Qa) was measured 30 times with the 5 minuets term. The nozzle chamber setup was defined as standard equipment in the whole test. Thus total measurement reached at 300 times for the each testing setup (inlet chamber and inlet duct setup) as shown in the table 3.
3.4. Testing for the repeatability of air flow rate
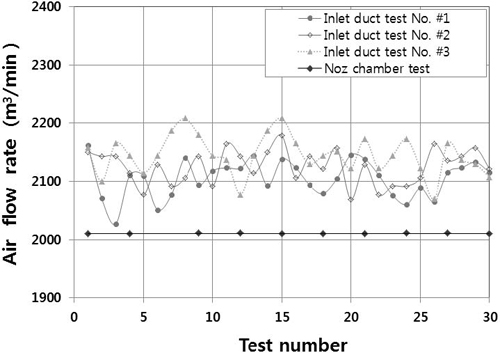
Test consecutively measured 30 times during 5 minutes with the 5 minutes delay as shown in table 8. During the measurement, the total pressure (Pt) and air flow rate (Qa) was fixed. Although the total pressure (Pt) and static pressure (Ps) are different because of of structural differences between testing facilities, it is ideal that the air flow rate is corresponding in both facilities. The data was measured in the following condition: 1) all testing facilities are fixed, 2) all sensors are fixed, 3) the rpm of axial flow fan was fixed and 4) the degree of pitot tube axis was fixed parallel to the axis of the duct.
Although the standard deviation of measured air flow rate in inlet nozzle chamber setup was σ=0.54 but the standard deviation was σ=31.21 and airflow measurement error was ±4.75% in inlet duct setup. The result from the inlet duct setup was exceeding the allowable tolerance of air flow rate from AMCA 111-99. The measured air flow rate in inlet duct setup was continuously fluctuating as shown in the Fig. 6.
3.5. Air flow rate measurement in pitot tube array Inclined to various angle
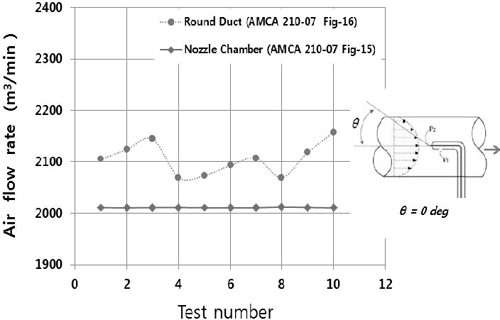
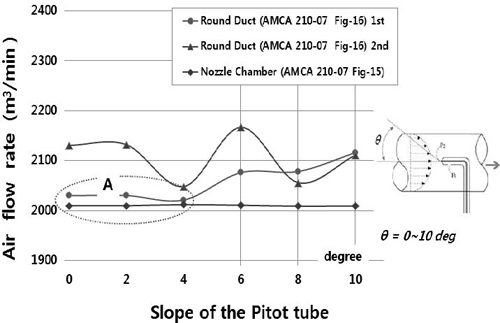
The total pressure (Pt) and air flow rate (Qa) measured at the inlet nozzle chamber. At this test, the degree of pitot tube array was arranged from 0 to 10 degree with 2 degree offset for measuring the air flow rate variation. The 0 degree of pitot tube array set as standard condition(Fig. 7). At each setup (0, 2, 4, 6, 8 and 10 degree), the air flow rates were measured 30 times for 5 minutes. Therefore, the number of trial reached at 180 times.
Although there were somewhat differences in total pressure and static pressure caused by structural differences at two testing facilities, similar air flow rate is best. The pitot tube axis have to be parallelly installed within 3 degree based on AMCA standard. The error of air flow rate until 4 degree of pitot tube was observed at allowable tolerance from laboratory accreditation program (AMCA 111-99) as shown in the Fig. 8“A”.
However, the average error which was repeatedly measured with same way was not accord with the ANSI/AMCA standard 210 because of fluctuation of air flow rate.
3.6. Result and discussion
In this trial, the air flow rate was compared inlet nozzle chamber as accredited laboratory facilities with the inlet duct setup. However, the estimation of uncertainty measurement with in allowable tolerance was failed because of fluctuation. The 95% confidence interval was calculated from the test result in the 3.4 section. The confidence interval can be expressed with equation (3) as follows:
The airflow rate measure at inlet duct setup and inlet duct setup can be shown in Fig. 9. In this figure, the errors and variation of air flow rate were expressed.
4. Conclusion
In this paper, the estimation of uncertainty measurement from the testing of axial flow fan with the inlet duct setup was difficult to get a satisfactory result. Based on the test result, the following conclusions were reached regarding the evaluation of the inlet duct setup:
1) The inlet duct setup was easily affected by external environments. It is severely harmful to repeatability.
2) Although the testing was conducted in the controlled environments, the result using suction duct is hard to get reliability and repeatability.
3) Although inlet duct setup is widely using in industrial field. Air flow rate measurement from inlet duct setup using a pitot tube is hardly reliable.
According to the ASHRAE, the testing errors could be reduced by the increment(7) of the quantity of pitot tubes. Thus the quantity of pitot tube would be increased in the next trial.
Acknowledgments
This research was supported by the Korea Institute of Industrial Technology Evaluation and Planning (ITEP) grant funded by the Ministry of Knowledge Economy (No. 10031698).
Notes
References
- Ko, H.-H., Chung, C.-Y., Kim, K.-Y., “An Evaluation of Performance Test and Uncertainty of Measurement for a Large Axial-flow Fan Based on ANSI/AMCA 210 Standard”, Proceedings of 2012 Annual Meeting of KFMA, KFMA_2012_SP07044, (2012).
- ANSI/AMCA Standard 210, “Laboratory Methods of Testing Fans for Certified Aerodynamic Performance Rating,” Air Movement and Control Association International, Inc, (2008).
- AMCA International Inc, Accredits Laboratory for Korea Machinery-meter and Petrochemical Testing and Rearch Institute, Original Accreditation Date August 26, 2009. Web: www.amca.org.
- http://www.kolas.go.kr.
- International Standard, ISO/IEC 17025-2005(E), “General requirements for the competence of testing and calibration laboratories,” Web: www.iso.org.
- AMCA Pub. 111-99, (R2007), “Laboratory Accreditation Program”, Annex B. Check Test Tolerances, p7.
- ASHRAE 111-2008, “Measurement, Testing, Adjusting, and Balancing of Building HVAC Systems”, Web: www.ashrae.org.
