Performance Improvement of Very Low Head Cross Flow Turbine with Inlet Open Duct
The cross flow turbine is economical because of its simple structure. For remote rural region, there are needs for a more simple structure and very low head cross flow turbines. However, in this kind of locations, the water from upstream always flows into the turbine with some other materials such as sand and pebble. These materials will be damage to the runner blade and shorten the turbine lifespan. Therefore, there is a need to develop a new type of cross flow turbine for the remote rural region where there is availability of abundant resources. The new design of the cross flow turbine has an inlet open duct, without guide vane and nozzle to simplify the structure. However, the turbine with inlet open duct and very low head shows relatively low efficiency. Therefore, the purpose of this study is to optimize the shape of the turbine inlet to improve the efficiency, and investigate the internal flow of a very low head cross flow turbine. There are two steps to optimize the turbine inlet shape. Firstly, by changing the turbine open angle along with changing the turbine inlet open duct bottom line (IODBL) location to investigate the internal flow. Secondly, keeping the turbine IODBL location at the maximum efficiency achieved at the first step, and changing the turbine IODBL angle to improve the performance. The result shows that there is a 7.4% of efficiency improvement by optimizing turbine IODBL location (open angle), and there is 0.3% of efficiency improvement by optimizing the turbine IODBL angle.
Keywords:
Very low head cross flow turbine, Inlet open duct bottom line, Performance improvement, Internal flow, 초저낙차 횡류수차, 유입구 개방형 덕트 바닥선, 성능개선, 내부유동1. Introduction
The environmental problems such as global warming, pollution problems and so on, have been considered as inevitable issues. Therefore, the necessity of the use of renewable energy as one of the clean and sustainable natural energy resources has risen[1]. The cross flow turbine attracts special attention as one of the different kinds of small hydroturbine. The traditional cross flow turbines have already been developed, such as Kokubu. K et al.[2, 3], by introducing inner guide into runner passage to improve the performance. There are also some new ideas to improve performance of traditional cross flow turbines by supplying air into the chamber[4]. However, there are three important parts that are the guide vane, nozzle and closed inlet water channel in the traditional cross flow turbine, which make the structure more complex and increases cost of manufacturing. In addition, as the cross flow turbine is applied in the rural area, there are some material of sediment such as the sand, pebble and mud from upstream flowing into the runner passage. These materials cause the turbine to breakdown and shorten the lifespan. Therefore, there is a need for a new type of cross flow turbine without guide vane and nozzle, but with inlet open duct to make the structure simpler for the rural areas. This kind of turbine should also be protected from the material of sediment being sucked into the runner passage. However, the turbine with inlet open duct and very low head shows relatively low efficiency. Therefore, the purpose of this study is to optimize the shape of turbine inlet to improve the efficiency, and investigate the internal flow of a very low head cross flow turbine. There are two steps to optimize the turbine inlet shape. Firstly, by changing the turbine open angle along with changing the turbine inlet open duct bottom line (IODBL) location to investigate the internal flow. Secondly, keeping the turbine IODBL location at the maximum efficiency achieved at the first step, and changing the turbine IODBL angle to improve the performance.
2. Cross Flow Turbine Model and Numerical Methods
2.1. Cross Flow Turbine Model
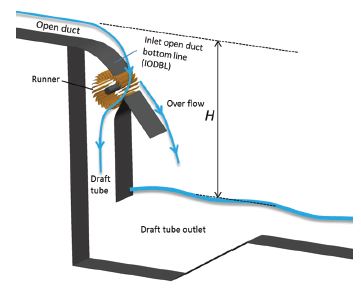
Figure 1 shows the schematic view of the new type of cross flow turbine model. The structure of the turbine consists of open ducted water channel, runner and draft tube, without guide vane and nozzle. The draft tube is included in the turbine to reduce the pressure at the top of the draft tube, and thus, to suck water into the turbine chamber.
The water flow from open water channel separates into two flows: one part of the water flows into the draft tube through the runner passage, and the other overflows to the downstream with some materials of sediment, preventing damage to the runner structure.
The number of the blade is Z=26 and the diameter of the runner is D=372mm. The inlet and outlet angles of the blade are βb1=33° and βb2=83°, respectively. The widths of the inlet water channel, tank and the draft tube are all same b=300mm. The design point of the present test turbine for the effective head is H=4.3m, which is relatively very low in contrast to other typical cases of hydro turbine’s head.
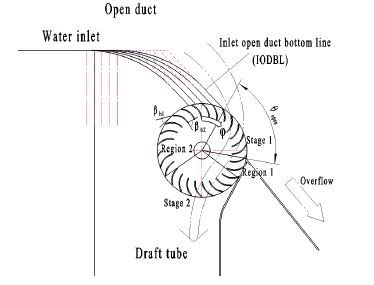
Figure 2 and Table 1 shows the cases of different turbine IODBL location. To investigate the effect of the turbine IODBL location on the performance, 5 cases of different turbine open angle (θopen) are examined. The shape of turbine IODBL denoted as Type A are combined by a curve and a straight line for the 5 cases. With the different turbine open angles, the turbine inlet locations are different. The turbine IODBL location of Case 3 is at the top of runner periphery. These 5 cases are conducted at the rotational speed of 200 min-1, which is selected at the maximum efficiency.
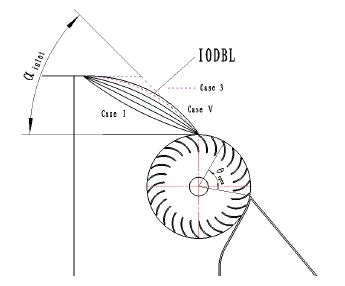
Figure 3 and table 2 shows the variation cases of turbine IODBL angle (αinlet). From Case Ⅰ to Case Ⅴ, the turbine IODBL angle is increased from 15° to 52°. The curve of turbine IODBL angle at 52° is tangent to the bottom of turbine inlet channel, which means 52° is the maximum for turbine IODBL angle. Unlike Fig. 2, to examine the effect of turbine IODBL angle on the performance, the turbine IODBL shape from Case Ⅰ to Case Ⅴ in Fig. 3, denoted by Type B, is made by a curved line only. The IODBL angle of Case Ⅳ is same as that of Case 3. The shape of Case 3 is marked by dashed line in Fig. 3.
2.2. Numerical Methods
For the numerical analysis on the turbine performance and internal flow, a commercial code of ANSYS CFX is adopted. The numerical grids are made in two dimensional geometry in order to shorten the time of transient twophase flow calculations. For the turbulence model, SST model is adopted. The boundary condition for normal speed is set for the water flow at the inlet and outlet, and the velocity of 0 m/s is set for the air flow. The boundary condition of opening is set at the open duct and downstream.
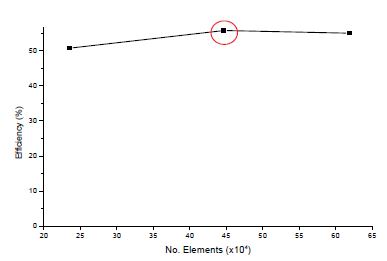
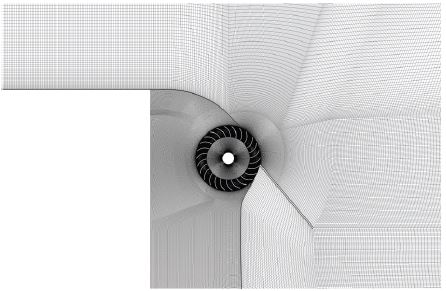
Figure 4 shows the numerical mesh dependence test. There are three different mesh numbers for whole flow field domains to examine the numerical mesh dependence. From the result, we can see that the efficiency of the numerical element number greater than 4.5×10⁵ is almost stable. Therefore, the numerical element number of about 4.5×10⁵ for the whole flow field has been used. Figure 5 shows the hexahedral numerical mesh for the cross flow turbine model. The test model is calculated by transient calculation with the effect of gravity.
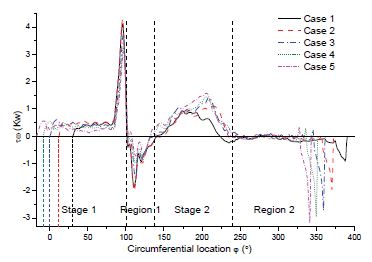
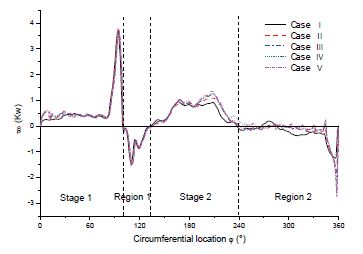
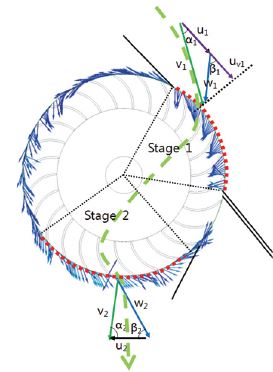
The area of the runner passage can be divided into four regions by the flow patterns in the runner passage as shown in Fig. 2. Stage 1 obtains first output power and Stage 2 takes second output power. However, Region 1 and Region 2 consume output power by hydraulic loss. The starting and ending locations of each stage and region depends on the output power. The locations are determined after the CFD calculation as seen later in Figs. 9 and 10.
3. Results and Discussion
3.1. Performance curves
The efficiency is calculated based on the potential energy difference between the upstream and downstream by the following equation:
where η is the efficiency of the turbine; T is the output torque; ω is the angular velocity; H is the water level difference between upstream and downstream as shown in Fig. 1; Q is the flow rate in the draft tube.
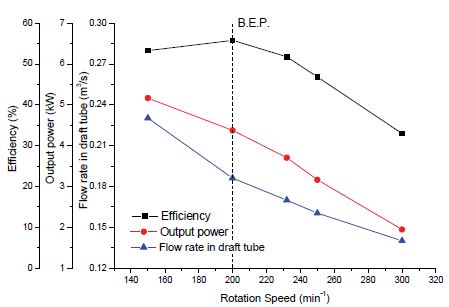
Figure 6 shows the performance curves of the cross flow turbine by different rotational speed. The output power and the flow rate decreases along with the increase in rotational speed. The peak efficiency is achieved at the rotational speed of 200 min-1. However, the efficiency only reaches to 55.8% which is too low for practical application. The flow rate and output power reduce rapidly along with increasing rotational speed.
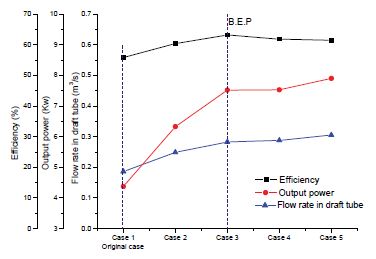
Figure 7 shows the performance curves by turbine IODBL location conducted at the rotation speed of 200 min-1. Case 1 is the original case. The peak efficiency is achieved as 63.2% at Case 3. In comparison to the original case (Case 1), there is 7.4% of efficiency improvement by optimizing turbine IODBL location.
The overall trend of output power and flow rate in the draft tube is increased along with increasing the open angle in Table 1 from Cases 1 to 5.
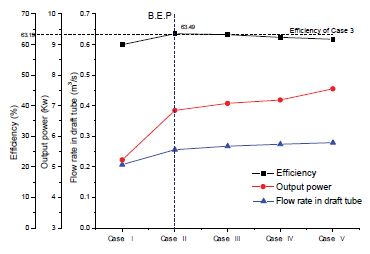
Figure 8 shows the performance curves by turbine IODBL angle. The efficiency of Case Ⅳ is slightly lower than that of Case 3. Even though the IODBL angle (αinlet) of these two cases is the same, but the IODBL shape of Case 3 (Type A) is different from that of Case Ⅳ (Type B) as shown in Figs. 2 and 3. The peak efficiency is achieved at the turbine IODBL angle of 25°. There is 0.3% of efficiency improvement by optimizing turbine IODBL angle, and the efficiency is increased to 63.5%. The output power and flow rate in the draft tube increases along with increase in turbine IODBL angle.
3.2. Output power distribution
To investigate the performance of the very low head cross flow turbine, the output power distribution around the runner is examined as show in Figs. 9 and 10.
Figure 9 shows the local output power distribution at the circumferential location by turbine IODBL location. The circumferential location (φ) starts at top of the runner periphery as shown in Fig. 2. The turbine open angle αopen increases from Cases 1 to 5, and the turbine IODBL location of Case 3 is at the top of the runner periphery. Therefore, the circumferential location of Stage 1, for Case 3 starts at 0°, for Cases 1 and 2 it starts less than 0° and for Cases 4 and 5 it starts larger than 0°.
Figure 10 shows the local output power distribution at the circumferential location by turbine IODBL angle. There is a slight difference in output power at the beginning of Stage 1, while the output power is similar after the circumferential location of about 60° in comparison to these five cases. After the circumferential location of about 180°, the output power appears to have changed again at Stage 2 and Region 2. The output power tendency of Case I at Region 2 is much different with other cases, which is caused by the turbine IODBL concave shape of Case I as shown in Fig. 3.
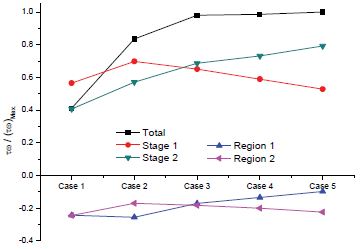
Figure 11 shows the averaged output power ratio at each region by IODBL location. All the averaged output power are divided by the total output power of Case 5, which is the maximum output power (τω Max.). The result shows that the overall trend of the total output power rises from Cases 1 to 5, which is in agreement with the trend of output power curve in Fig. 7. With increasing turbine open angle θopen (Case 1→ 5), the output power drops at Stage 1, except for Case 1, even though the circumferential range of Stage 1 increases. Along with increasing open angle θopen (Case 1→ 5), the output power at Stage 2 rises. For the turbine IODBL location before the top of runner periphery (θopen<100°), the amount of output power at Stage 1 is larger than that at Stage 2. Regions 1 and 2 are where loss of torque occurs to a large extent. The negative output power at Region 1 reduces along with increasing turbine inlet open angle, however, at Region 2 it augments slightly.
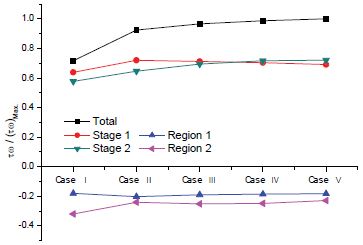
Figure 12 presents the averaged output power ratio at each region by IODBL angle. All the output power are divided by the total torque of Case Ⅱ which has maximum output power. This figure shows that the output power at Stage 1 increases from Case Ⅰ to Ⅱ, then decreases slightly, and it gradually rises at Stage 2. However, at Regions 1 and 2, it has almost no change from Case Ⅱ to Ⅴ. Overall, the total output power increases along with increasing the turbine IODBL angle from Case Ⅰ to Ⅴ.
The effect of increasing the turbine open angle gives merit to increasing output power at Stage 2 and suppressing the negative output power at Region 1. However, it has counter effect at Stage 1 and Region 2. Moreover, enlarging the turbine IODBL angle gives considerable effect on the output power at Stage 2, but the effect is poor at Stage 1, Regions 1 and 2.
3.3. Velocity triangle distribution
The velocity triangle is measured to investigate the internal flow in detail. Figure 13 shows the selected runner periphery for investigation of velocity triangle at Stages 1 and 2. α is the absolute angle that is between absolute velocity(V) and tip rotational speed(u). β is the relative angle that is between relative velocity(w) and tip rotational velocity(u). βb is the inlet angle of blade. According to the related study results by Mockmore et al.[5] for the maximum efficiency, the relative angle(β) should be close to the inlet angle of the blade(βb). For no kinetic energy loss at outlet of runner, the absolute angle(α) of outflow at Stage 2 should be close to 90°.
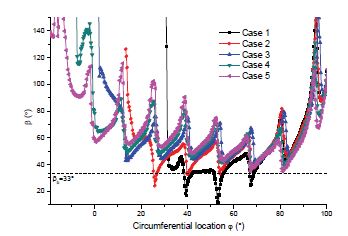
Figure 14 shows the relative angle(β) distribution at the runner inlet periphery of Stage 1 by turbine IODBL location. With increasing turbine open angle from Case 1 to 5, the relative angle(β) is farther away from the inlet angle of blade(βb). The β of Case 1 is almost equal to βb, which means that there is no separation flow between water flow and blade surface in the runner passage for Case 1. Moreover, the β is closer to βb when the circumferential location φ is between 20° and 80°.
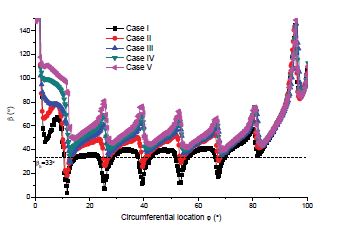
Figure 15 shows the relative angle(β) distribution at the runner inlet periphery of Stage 1 by turbine IODBL angle. The case of relative angle(β) most closest to βb is Case Ⅰ. Furthermore, from Cases Ⅱ to Ⅴ, the relative angle(β) is farther away from βb which means with increasing the turbine IODBL angle, the relative angle(β) will be farther away from βb resulting in flow separation between water flow and blade surface.
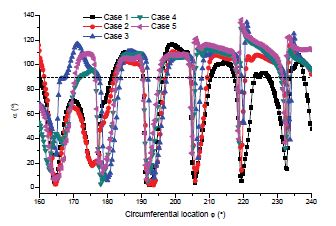
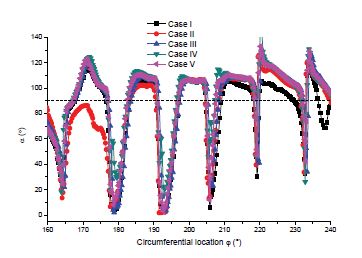
Figures 16 and 17 shows the absolute angle(α) distribution at the runner outlet periphery of Stage 2 by turbine IODBL location and angle, respectively. The dash line is included to easily compare the absolute angle(α) at outlet and check if it is close to 90°. The absolute angle(α) shows almost no change from circumferential location of 180°-220°, because at this range most of the output power is generated. Furthermore, the absolute angle(α) is slightly larger than 90°, which means that the absolute angle(α) is not at the highest efficiency point.
The velocity triangle results imply that the effect of large turbine open angle and low turbine IODBL angle gives counter effect to output power of turbine at Stage 1, while it is monotonous at Stage 2.
3.4. Velocity distribution around the runner
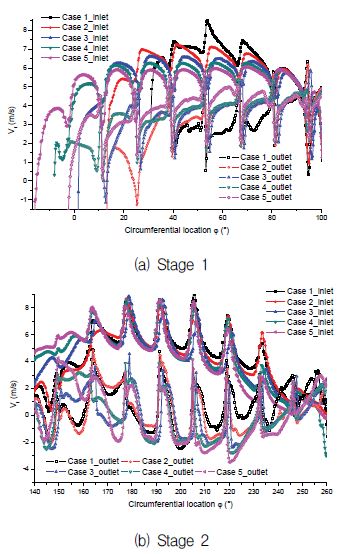
The cross flow turbine is a kind of impulse turbine, the velocity is very important for generating power. The energy is transferred from the flowing current to the rotating system. Hence, the tangential velocity (Vt) on the runner periphery is examined for investigating the internal flow as shown in Fig. 18. The tangential velocity on runner inlet periphery and outlet rim are examined at Stages 1 and 2, respectively. There are larger variations between the tangential velocity on the runner periphery, because of the blade.
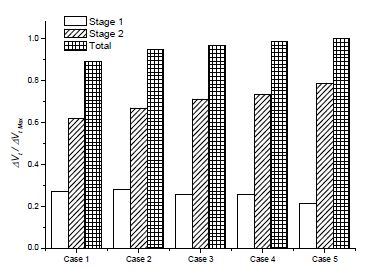
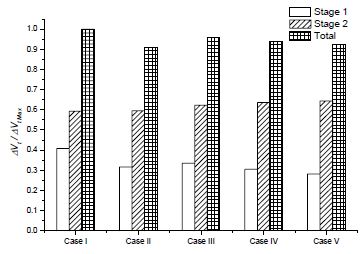
In order to clearly reveal the difference of tangential velocity, the averaged tangential velocity difference at Stages 1 and 2 by turbine IODBL location and angle are measured in Figs. 19 and 20, respectively.
From Fig. 19, it is obvious that with turbine open angle augmenting, the difference in tangential velocity increases at Stage 2. However, at Stage 1, it declines slightly, but the total velocity difference rises. Therefore, the case which has the largest total tangential velocity difference is Case 5, which means that the output power generated by tangential velocity difference increases along with augmenting the turbine open angle. However, the total tangential velocity reduces slightly by changing the turbine IODBL angle from Cases Ⅰ to Ⅴ as shown in Fig. 20. The effect of augmenting turbine open angle on the velocity difference is significant. However, the effect is opposite if the turbine IODBL angle is increasing.
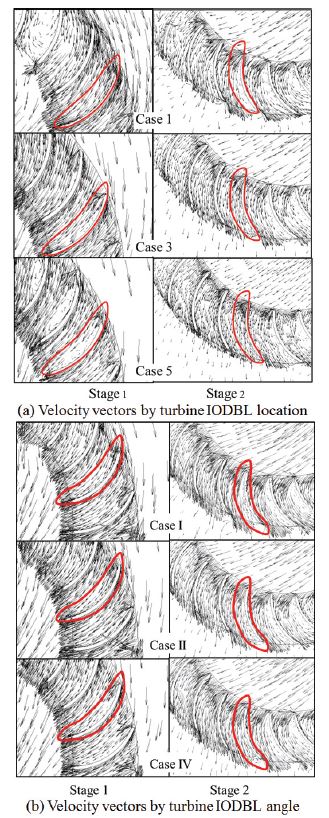
Figure 21 presents the velocity vectors on the runner passage at Stage 1 and 2 by three typical cases (Cases 1, 3, 5) for turbine IODBL location and three typical cases (Cases I, II, IV) for IODBL angle, respectively. There is uniform and smooth flow through the runner passage at small turbine open angle (Case 1). However, for large turbine open angle cases, the flow in the runner passage separates, and there are large recirculation flow on the runner passage, which caused by the relative angle(β) of Case 5 being far away to blade inlet angle (βb) as seen in Fig. 14. However, at Stage 2, the water flow in Case 5 is the most uniform and smooth through the runner passage in contrast to other cases. That has same tendency for the cases with different turbine IODBL angle from Cases I to IV (Fig. 21 (b)). The tangential velocity and velocity vector distribution results imply that the effect of increasing turbine IODBL angle gives significant effect on the velocity difference of turbine at Stage 2, while at Stage 1 the effect is opposite. However, the effect on the total velocity difference is considerable to enhance performance of the turbine.
3.5. Pressure distribution around the runner blade
The cross flow turbine is a kind of impulse turbine, but this is a very low head cross flow turbine with a draft tube. Hence, pressure around the runner blade is also important for generating output power. The pressure coefficient(Cp) is calculated by the following equation:
where p is the local static pressure on the runner blade surface.
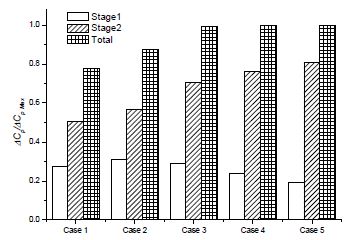
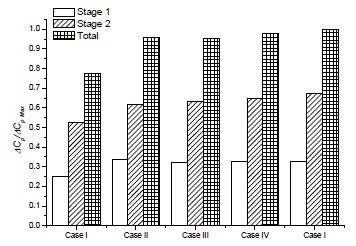
Figures 22 (a) and (b) shows the averaged pressure coefficient distribution around the runner blade surface at Stages 1 and 2, respectively. There are two parts of ΔCp1 and ΔCp2 in the closed area filled with the Cp curve. The area of ΔCp1 is filled by the Cp curve where the suction side pressure is larger than pressure side, which means the output power generated by this part of pressure difference is negative. However, for the ΔCp2, it is contrary to that of ΔCp1, and the output power made by this part of pressure difference is positive. Therefore, the effective area ΔCp (ΔCp=ΔCp2-ΔCp1), which is the effective pressure coefficient, is important for generating output power. The effective pressure coefficient is measured in Figs. 23 and 24. The ordinate is defined as effective pressure ratio. All the effective pressure differences (Cp) are divided by that of each maximum pressure coefficient (CpMax).
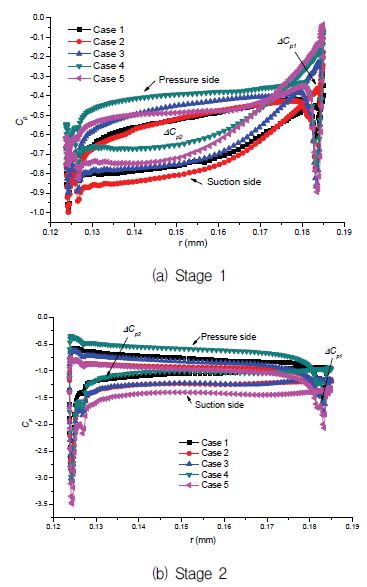
Averaged pressure coefficient distribution around the surface of runner blades at Stage 1(a) and Stage 2(b) by turbine IODBL location
From the Fig. 23, the effective pressure difference ratio increases rapidly at Stage 2 with increasing turbine inlet open angle, while at Stage 1, the effective pressure difference reaches to a maximum for Case 2, and then it decreases. However, the total pressure difference increases from Case 1 to 5, and there is maximum ΔCp for Case 5. For the cases of turbine IODBL angle shown in Fig. 24, the effect of larger IODBL angle on the pressure difference is considerable, especially from Cases Ⅰ to Ⅱ, the improvement of pressure difference is significant.
Combining the velocity difference and pressure difference, there are some discussion. For turbine IODBL location, from Case 1 to 2 the velocity difference is almost similar at Stage 1. However, the pressure difference of Case 2 is higher than that of Case 1 at Stage 1, which is also indicated by the averaged output power in Fig. 11. Moreover, for the turbine IODBL angle, from Cases Ⅰ to Ⅱ, even though the velocity difference decreases rapidly at Stage 1, the pressure difference rises, so the output power at Stage 1 increases. The result implies that the pressure difference is more important than the velocity difference, although it is a cross flow turbine.
4. Conclusions
According to the investigation of the influence of the turbine IODBL location and turbine IODBL angle, the following conclusions are obtained:
1. There is a 7.4% of efficiency improvement by optimizing turbine IODBL location. The case of turbine IODBL location at the top of runner has the highest efficiency and it is achieved to 63.2%. Moreover, by optimizing the turbine IODBL angle, there is 0.3 % of efficiency improvement, and it is achieved to 63.5%.
2. Increasing the turbine open angle gives considerable effect on the output power at Stage 2 and suppresses negative output power at Region 1. However, it has opposite effect at Stage 1 and Region
3. In addition, the effect of larger turbine IODBL angle on the output power is significant only at Stage 2, while it has opposite effect at Stage
4. With increasing the turbine open angle and turbine IODBL angle, the relative angle(β) at flow inlet of Stage 1 is farther away from blade inlet angle (βb), and there is almost no effect on the absolute angle(α) at flow outlet of Stage
5. Increasing turbine open angle and turbine IODBL angle gives significant effect on the tangential velocity difference and pressure difference of the turbine at Stage 2, but the effect is poor at Stage 1.
Acknowledgments
논문은 2014학년도 목포대학교 연구소 활성화 지원비 지원에 의하여 연구되었음
References
- Sorensen, B., Renewable Energy Conversion, Transmission and Storage, Elsevier, (2007).
-
Kokubu, K., Kanemoto, T., Yamasaki, K., “Guide Vane with Current Plate to Improve Efficiency of Cross Flow Turbine”, Journal of Fluid Dynamics, (2013), 3(2A), p28-35.
[https://doi.org/10.4236/ojfd.2013.32A005]

-
Kokubu, K., Yamasaki, K., Honda, H., Kanemoto, T., “Effect of inner guide on performance of cross flow turbine”, 26th IAHR Symposium on Hydraulic Machinery and Systems, (2012), 15(4).
[https://doi.org/10.1088/1755-1315/15/4/042035]

-
Choi, Y. D., Shin, B. R., Lee, Y. H., “Air Layer Effect on the Performance Improvement of a Cross-Flow Hydro Turbine”, Journal of Fluid Machinery, (2010), 13(4), p37-43.
[https://doi.org/10.5293/KFMA.2010.13.4.037]

- Mockmore, C. A., Merryfield, F., The Banki Water Turbine, In Bullettin Series, Engineering Experiment Station; Oregon State System of Higher Education, Oregon State College: Corvallis, USA, (1949).
- ANSYS Inc, “ANSYS CFX Documentation”, (2013), 14, http://www.ansys.com.
