PEMFC 성능 향상을 위한 산소극 협로형 분리판 설계
Abstract
This study applied a multiscale, multiphase PEMFC model to simulate the cell performance for three different cathode flow field designs, including conventional(rectangular, trapezoidal), and orifice-shaped flow field designs. The results demonstrated that the orifice-shaped flow field designs allowed for uniform distribution of oxygen concentration, ensuring its efficient supply to the outlet. Also, at a high current density of 2.0A/cm2, the orifice-shaped design exhibited reduced concentration losses and improved performance compared to conventional flow field designs.
Keywords:
PEMFC, Orifice-shaped flow field, High-power, Mass transfer키워드:
고분자 전해질 연료전지, 협로형 유동장, 고출력, 질량 전달1. 서 론
고분자 전해질 연료전지(Polymer Electrolyte Membrane Fuel Cell, PEMFC)는 뛰어난 부하 변동성을 가지며 낮은 작동온도에서도 높은 전력밀도를 유지한다. 이러한 특징들을 바탕으로 수송용 연료전지 장비로 사용되기에 적합하다고 판단하였다.1-3)
PEMFC는 일반적으로 물의 포화온도 아래에서 작동되며 다공성층(Porous media)으로 구성된다. 가습된 기체의 형태로 투입되는 연료 및 산소와 전기 화학반응을 통해 생성되는 물이 액화되어 단위 전지 내에 분포하기 때문에 다상 유동(Two-phase)으로 구현하는 것이 중요하다. 그리고 채널 설계는 높은 전류밀도에서 액상 물의 생성과 촉매층의 산소 분포에 큰 영향을 미치기 때문에 PEMFC 설계에 있어 핵심적인 부분이다. Wang 은 PEFMC 채널 형상을 개발하기 위해 PEMFC 모델을 개발하였고, Hashemi 는 인접 채널간의 압력차가 다공성 영역의 구성품 내부의 물질 이동을 야기한다고 주장하였다.4-6)
본 논문에서는 3차원 채널 설계 연구를 바탕으로 직사각형, 사다리꼴형 및 협로형 유동장 설계가 화학종 전달 및 열 전달에 미치는 영향과 이로 인한 성능 변화를 검토한다. 협로의 면적 변화로 인해 반응물 공급 채널의 폭과 깊이가 감소하여 대류가 강하게 생성되고 반응물 공급 및 액상 물 제거의 효율도 향상된다. 또한, 냉각수가 단면을 통과해 흐르기 때문에 채널과 분리판 사이의 온도 차이가 감소하여 PEMFC 내부가 보다 균일한 온도 분포를 갖게 된다. 본 연구에서는 넓은 범위의 전류밀도에 걸쳐 3차원 PEMFC 시뮬레이션이 수행되었으며 특히 고전류밀도에서의 협로의 영향성으로 인한 성능 향상에 대한 구체적인 분석을 진행하였다.
2. PEMFC 모델
2.1 모델 시뮬레이션 및 가정
본 연구에서는 다양한 채널 설계 아래에서의 PEMFC 단일 전지에 대한 전기화학 및 열유동 해석을 진행하기 위해 상용해석 프로그램인 ANSYS-FLUENT 패키지를 사용하였다.
3D two-phase PEMFC 모델의 가정은 다음과 같다.
(1) 낮은 작동 압력 조건으로 인해 기체 혼합물은 이상기체로 가정한다.
(2) 기체 유동은 층류와 비압축성으로 가정한다.
(3) 중력의 영향은 무시한다.
(4) 다공성 영역인 기체 확산층, 미세다공층, 촉매층의 특징이 반영되어 보정된 기공도와 투과도를 사용한다.
(5) 촉매층에서 백금 입자는 균일한 크기의 구형을 가지며 이오노머(Ionomer) 막으로 덮여있다고 가정한다.
2.2 지배방정식
본 연구에서 사용된 모델은 질량(Mass), 모멘텀(Momentum), 열에너지(Thermal energy), 화학종(Species), 전하(Charge) 보존법칙에 의해 표현될 수 있다.
질량 보존식
| (1) |
모멘텀 보존식
| (2) |
화학종 보존 방정식
Flow channels and porous media
| (3a) |
Water transport in the membrane
| (3b) |
에너지 보존식
| (4) |
전하 보존식
Proton transport
| (5) |
Electron transport
| (6) |
HOR in anode CL
| (7) |
ORR in cathode CL
| (8) |
Table 1, Table 2의 수식을 통해 Two-phase mixture 모델을 구현하고, 전극에서의 물 이동에 대한 해석을 진행하였다.
2.3 3차원 다상유동 멀티스케일 PEMFC 모델
본 연구에서 사용된 매크로 스케일 PEMFC 모델은 질량, 모멘텀, 화학종, 전하, 및 열 에너지의 다섯가지 보존 방정식을 지배 방정식으로 구현하였다. 이러한 보존 방정식들은 산화극 및 환원극의 촉매층에서 각각 수소산화반응(Hydrogen Oxidation Reaction, HOR) 및 산소환원반응(Oxygen Reduction Reaction, ORR)과 관련된 생성/소모 항과 결합된다. 생성/소모 항은 사용자 정의 함수(User-Defined Functions, UDFs)로 구현되고 ANSYS FLUNT에 통합된 수송 방정식으로 해석한다. PEMFC 모델에 사용된 지배 방정식과 생성/소모 항은 식 (1)∼(8)으로 정의되어 있다. 또한 Table 1은 다양한 PEMFC 구성요소의 물리화학적, 운동학적 및 수송 특성을 보여준다. PEMFC의 Flooding과 관련된 다상유동 모델은 Wang과 Cheng에 의해 개발되었다.7) Table 2는 다상유동 모델에 사용된 다상 특성과 그 관계를 나타낸다.
2.4 Forchheimer의 관성 효과 적용
다공성 영역에서 유체는 일반적으로 Darcy의 법칙을 따른다. 하지만 PEMFC 3차원 유동장에 협로 형상이 적용되면서 관성 효과가 증가하여 유속이 높아지고 이로 인해 비선형적인 압력 변화를 초래한다. 이러한 효과를 반영하기 위해 Table 3의 Darcy-Forchheimer 모델을 적용하여 해석을 진행하였다.8∼9)
2.5 모델 형상과 경계조건
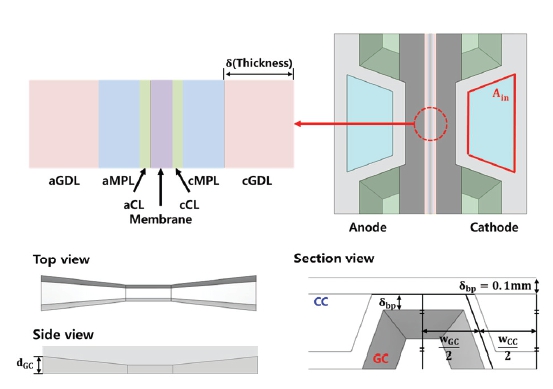
본 연구의 3차원 다상유동 멀티스케일 PEMFC 모델의 형상은 Fig. 1의 직사각형, 사다리꼴형, 협로가 적용된 사다리꼴형으로 총 3가지이다. Fig. 2는 전체적인 협로 유동장과 부분적인 협로의 위, 옆, 단면이며, 자세한 치수는 Table 4에 표시되었다.
다양한 채널 설계에서의 영향성을 확인하기 위해 Table 5의 작동 조건으로 동일하게 적용하되 전류밀도의 경우 0.1∼2.5A/cm2 으로 저전류에서 고전류까지 변화를 주어 영향성을 비교하였다.
해석을 진행하기 위한 경계조건은 식 (9)∼(14)이며 이를 통해 해당 전류밀도에서의 연료극, 산소극, 냉각채널의 유체 속도를 정의하였다. 그리고 양 극의 벽면에 동일한 전압 혹은 전류밀도를 적용하여 결과를 비교하였다.
Anode inlet velocity
| (9) |
Cathode inlet velocity
| (10) |
Coolant inlet velocity
| (11) |
Anode side wall
| (12) |
Cathode side wall
| (13) |
| (14) |
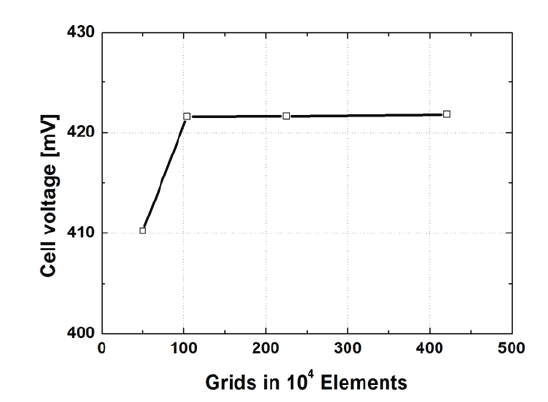
Fig. 3은 격자 의존성 시험결과이며 약 100만개 이상부터는 성능변화가 적어 최소 격자수는 100만개로 설정하여 해석을 진행하였다.
3. 해석 결과
본 연구에서는 앞서 언급되었듯이 산소극 채널을 직사각형, 사다리꼴형, 협로가 적용된 사다리꼴형으로 총 3가지 형상에 따른 해석결과를 비교하였다.
Fig. 4는 전류밀도에 따른 성능 변화에 대한 그래프로 2.5A/cm2까지 1.0bar 조건으로 결과를 확인하였다. 그래프를 보면 중⋅고전류로 갈수록(1.0A/cm2이상) 채널 단면이 사다리꼴형일 때 직사각형보다 성능이 더 향상되는 것을 볼 수 있다. 협로형의 경우 사다리꼴형에 비해 고전류일 때(2.5A/cm2이상) 성능이 향상된 것을 볼 수 있다.
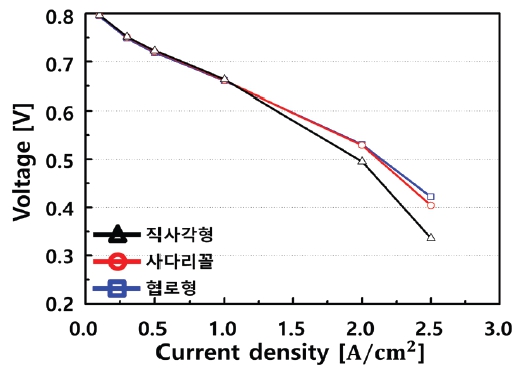
Polarization curves for the three flow field designs. The operating pressure is 1.0 bar at the operating current densities from Iavg=0.1 to 2.5A/cm2
Fig. 5는 형상별 cathode Catalyst Layer(cCL) 중간면에서의 산소농도 분포를 보여준다. 협로형의 경우 출구부까지 산소를 원활히 전달하여 전체적인 분포로 봤을 때 산소가 부족하여 반응이 일어나지 않는 부분을 감소시켜 주는 것을 볼 수 있다.
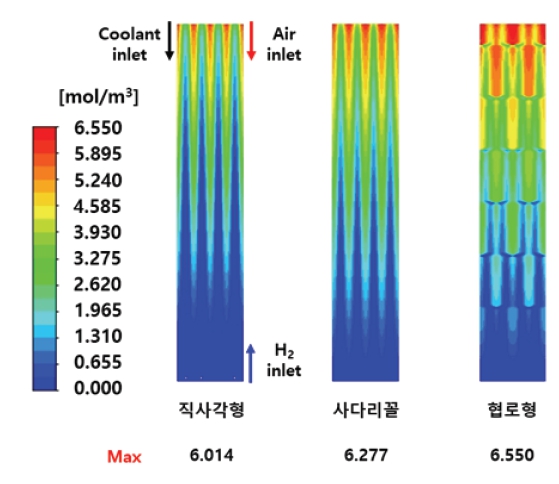
Oxygen concentration distribution contours over the middle of the cCL for the three flow field designs, observed at an operating current density of Iavg=2.0A/cm2 and 50% relative humidity
Fig. 6은 형상별 membrane 중간면에서의 전류밀도 분포도를 보여준다. 협로형의 경우 후단부까지 산소가 원활히 공급되어 표준편차 값이 가장 작아 전류밀도 분포도가 향상된 것을 볼 수 있다.
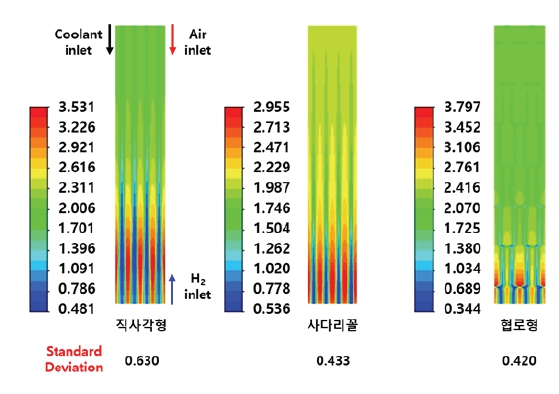
Current density distribution contours over the middle of the membrane for the three flow field designs, observed at an operating current density of Iavg=2.0A/cm2 and 50% relative humidity
Fig. 7은 형상별 XZ 단면에서 산소농도와 기체 속도, 액상 물 분포도와 액체 속도를 보여준다. 협로형의 경우 공기의 대류 효과가 강하여 산소를 냉각채널 밑의 랜드부분까지 전달을 원활히한다. 또한, 대류효과가 증가하여 랜드 부분의 GDL에 쌓인 물을 제거해주는 효과를 보인다.
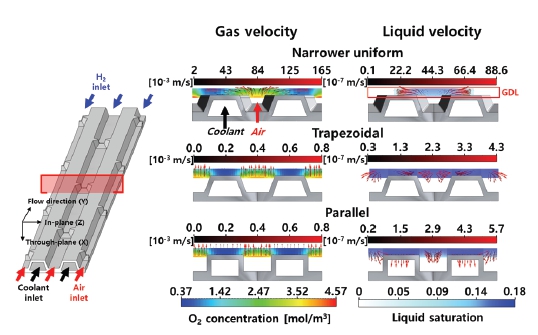
Oxygen concentration and liquid saturation contours, acoompanied by gas/liquid velocity vectors in the XZ cross-section of the cathode GDL at an operating current density of Iavg=2.0A/cm2 and 50% relative humidity
Fig. 8는 세 형상의 활성화 손실, 저항 손실, 농도 손실에 대한 그래프이다. 채널 형상에 따라서 농도 손실의 변화가 가장 지배적으로 작용하였으며 직사각형, 사다리꼴형, 협로형 순으로 농도손실이 작았다. 협로가 적용됨에 따라 출구부까지 산소 공급이 원활하여 산소 부족으로 인한 농도 손실이 감소하여 성능이 향상되었다. 하지만 Table 6에 따르면 협로형은 산소극 채널에서의 입구와 출구의 압력차(∆P)가 크게 증가하였다.
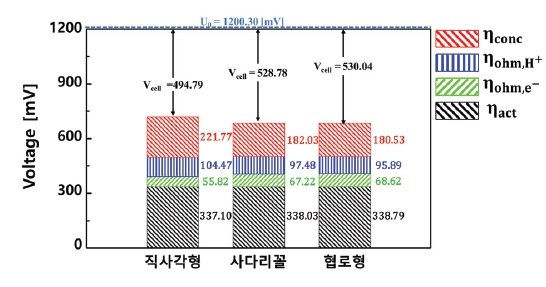
Breakdown of activation, ohmic, and concentration overpotentials for the three flow field designs at the operating current density of Iavg=2.0A/cm2 and 50% relative humidity
4. 결 론
본 연구는 다상유동-멀티스케일 PEMFC 모델을 통해서 유동분리판 형상에 의한 성능 변화를 분석하였다.
해석 결과 협로형 유동분리판 형상에서 가장 원활한 산소농도 분포를 보였으나 특히 고전류로 갈수록 성능이 다소 증가한 것을 확인하였다. 하지만 협로형 유동분리판은 압력강하적인 측면에서 손실이 커졌기 때문에, 이는 기생전력을 증가시킨다.
그러나 산소농도 분포도를 통해 알 수 있듯이, 협로 형상의 영향에 의해 랜드부에도 산소의 확산이 용이함을 확인할 수 있다. 이 장점을 유지하는 동시에 유동방향 기준 후단부까지 원활한 산소 공급이 가능하도록 설계할 경우, 농도과전압적 손실을 감소시킴으로써 전체적인 성능을 향상시킬 수 있다.
따라서 해당 연구는 협로의 배열에 변화를 줌으로써 Case-study 가 가능하며, 이는 최적의 성능을 가지는 유동분리판 형상을 선정하는 연구의 밑바탕이 될 수 있다.
Acknowledgments
2023 한국유체기계학회 하계학술대회 발표 논문, 2023년 7월 5일~7월 7일, 평창 알펜시아
본 연구는 한국산업기술평가관리원(KEIT)과 산업통상자원부(MOTIE)의 지원으로 수행되었습니다. (No.20012121)
References
-
Jo, A. R., Ju, H., 2018, “Numerical study on applicability of metal foam as flow distributor in polymer electrolyte fuel cells (PEFCs),” Int. J. Hydrogen Energy, Vol. 43, pp. 14012-14026.
[https://doi.org/10.1016/j.ijhydene.2018.01.003]

- Baek, J. H., Lee, E. K., Lee, J. W., Lee, S. K., Moon, J. S., Kim, K. H., Park, H. W., Kim, D. C., Lee, J. H., 2017, “A study on safety performance evaluation of NG blower for 5 kW class stationary fuel cell systems,” Trans. of the Korean Hydrogen and New Energy Society, Vol. 28, No. 6, pp. 675-682.
-
Palaniswamy, K., Marappan, M., Rajendran jothi, V., 2016, “Influence of porous carbon inserts on scaling up studied for performance enhancement on PEMFC,” Int. J. Hydrogen Energy, Vol. 41 pp. 2867-2874.
[https://doi.org/10.1016/j.ijhydene.2015.10.148]

-
Jo, A. R., Ahn, S. H., Oh, K. M., Kim, W. G., Ju, H., 2018, “Effects of metal foam properties on flow and water distribution in polymer electrolyte fuel cells (PEFCs),” Int. J. Hydrogen Energy, Vol. 43, No. 30, pp. 14034-14046.
[https://doi.org/10.1016/j.ijhydene.2018.01.134]

-
Wang, Y., Basu, S., Wang, C. Y., 2018, “Modeling two-phase flow in PEM fuel cell channels,” J. Power Sources, Vol. 179, pp. 603–617.
[https://doi.org/10.1016/j.jpowsour.2008.01.047]

-
Hashemi, F., Rowshanzamir, S., Rezakazemi, M., 2012, “CFD simulation of PEM fuel cell performance: effect of straight and serpentine flow fields,” Math. Comput. Model, Vol. 55, pp. 1540–1557.
[https://doi.org/10.1016/j.mcm.2011.10.047]

-
Wang, C. Y., Cheng, P., 1996, “A multiphase mixture model for multiphase, multicom- ponent transport in capillary porous media – I. Model development,” Int. J. Heat Mass Transf, Vol. 39, pp. 3607–3618.
[https://doi.org/10.1016/0017-9310(96)00036-1]

-
Kim, J., Luo, G., Wang, C., 2017, “Modeling two-phase flow in three-dimensional complex flow-fields of proton exchange membrane fuel cell,” J. Power Sources, Vol. 365, pp. 419-429.
[https://doi.org/10.1016/j.jpowsour.2017.09.003]

-
Lim, K., Vaz, N., Lee, J., Ju, H., 2020, “Advantages and disadvantages of various cathode flow field designs for a polymer electrolyte membrane fuel cell,” Int. J. Heat Mass Transf, Vol. 163, pp. 120497.
[https://doi.org/10.1016/j.ijheatmasstransfer.2020.120497]

-
Lim, B. H., Majlan, E. H., Daud, W. R. W., Husaini, T., Rosli, M. I., 2016, “Effects of flow field design on water management and reactant distribution in PEMFC: a review,” Ionics 22, pp. 301-316.
[https://doi.org/10.1007/s11581-016-1644-y]

-
Jiao, K., Ni, M., 2017, “Challenges, and opportunities in modelling of proton exchange membrane fuel cells (PEMFC),” Int. J. Energy, Vol. 41, pp. 1791-1940.
[https://doi.org/10.1002/er.3798]

-
Alrwashdeh, S. S., Manke, I., Markotter, H., Markotter, H., Hauβmann, J., Kardjilov, N., Hilger, A., Kermani, M. J., Klages, M., Al-Falahat, A. M., Scholta, J., Banhart, J., 2017, “Neutron radiographic in operando investigation of water transport in polymer electrolyte membrane fuel cells with channel barriers,” Energy Convers. Manage, Vol. 148, pp. 604-610.
[https://doi.org/10.1016/j.enconman.2017.06.032]

-
Lim, B. H., Majlan, E. H., Daud, W. R. W., Rosli, M. I., Husaini, T., 2020, “Numerical investigation of the effect of three-dimensional modified parallel flow field designs on proton exchange membrane fuel cell performance,” Chem. Eng. Sci, Vol. 217, pp. 115499.
[https://doi.org/10.1016/j.ces.2020.115499]

-
Wang, X. D., Xu, J. L., Yan, W. M., Lee, D. J., Su, A., 2011, “Transient response of PEM fuel cells with parallel and interdigitated flow field designs,” Int. J. Heat Mass Transf, Vol. 54, pp. 2375-2386.
[https://doi.org/10.1016/j.ijheatmasstransfer.2011.02.024]


